US Treasuries
- Treasuries rallied on strong jobs data
- 10s closed on Friday at 4.36 [Friday’s range in 10s: 4.34/4.39]
- 2s closed on Friday at 3.87 [Friday’s range in 2s: 3.87/3.925]
- 2y – 5y: + 12 bps
- 2y – 10y: + 47 bps
Intraday News Moving Markets
- April Nonfarm Payrolls beat expectations with 115,000 jobs added (65,000 expected)
- On Deck next week: CPI (Tuesday, 5/12)
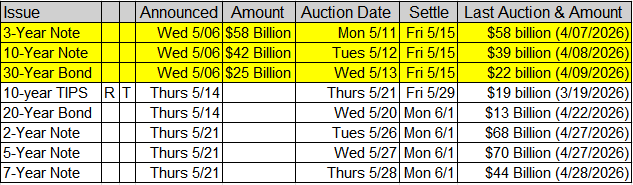
- On Deck next week: Treasury auctions: $58bn UST 3y (Mon, 5/11);$42 bn UST 10y (Tues, 5/12) and $25 bn UST 30y (Wed, 5/13)
- Fed Speak: Fed’s Goolsbee Says All Interest-Rate Options Are On the Table
- Bloomberg: Hassett, Asked on Gundlach Debt Idea, Says Not in Million Years
Upcoming US Treasury Supply
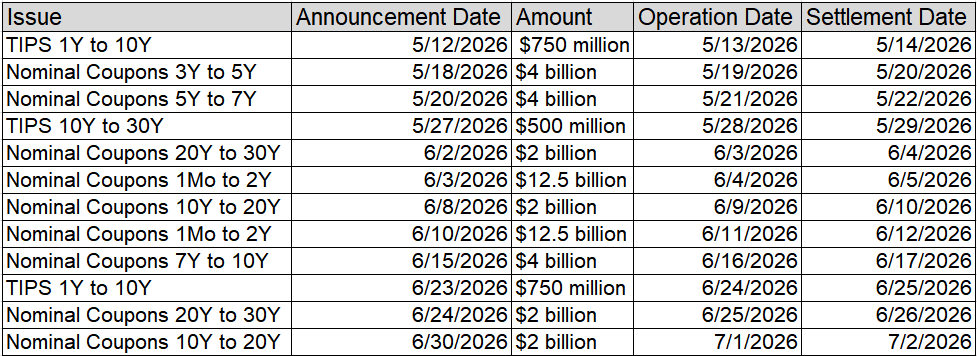
Treasury Buyback Schedule
Commodities
- Gold rose to $4,723 an ounce [87% of its recent high of $5,417 an ounce on 1/28/26]
- Silver rose to $80.52 an ounce [69% of its recent high of $116.70 an an ounce on 1/28/26]
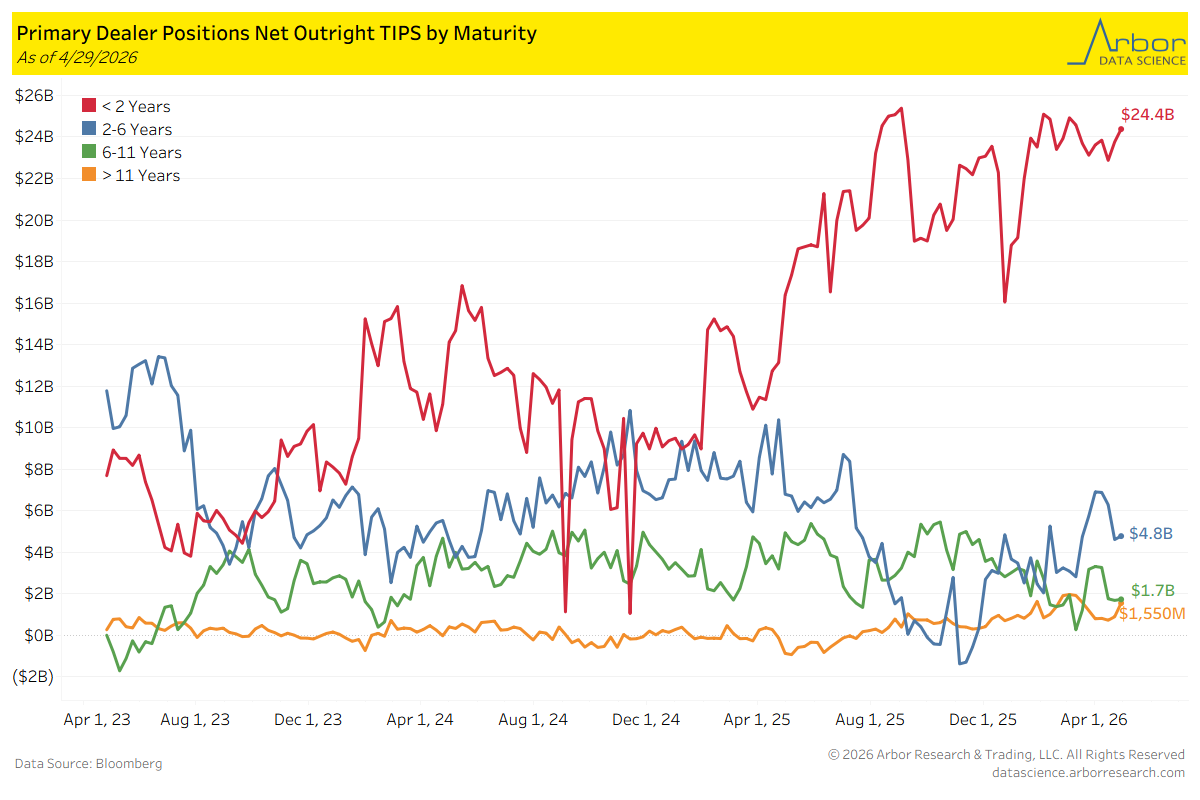
TIPS by Maturity (data through 4/29/2026)
Week over Week Changes by Maturity
- < 2 years: $23.8 Bn on 4/22/2026 to $24.4 Bn on 4/29/2026 = $0.6 Bn
- 2 – 6 years: $4.6 Bn on 4/22/26 to $4.8 Bn on 4/29/2026 = $0.2 Bn
- 6 – 11 years: $1.7 Bn on 4/22/2026 to $1.7 Bn on 4/29/2026 = $0.0 Bn
- > 11 years: $893 Mn on 4/22/2026 to $1,550 Mn on 4/29/2026 = $657 Mn
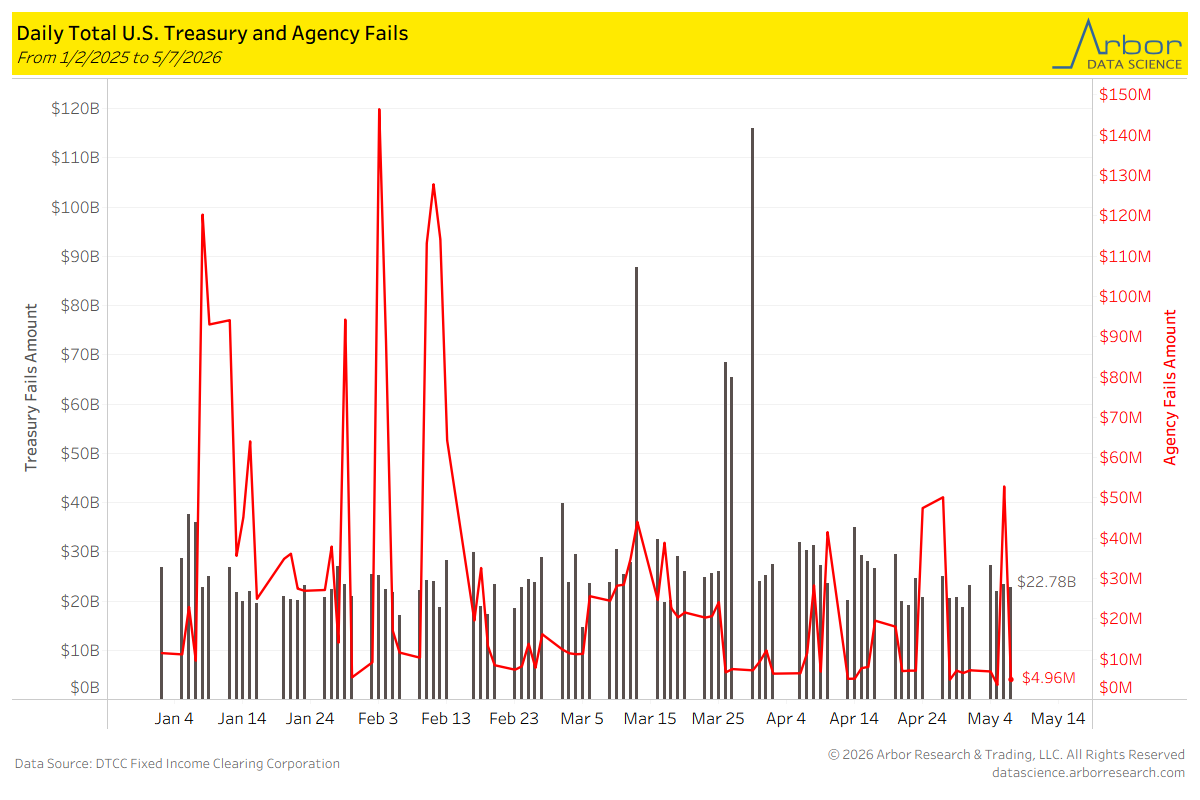
U.S. Treasury Trade Fails
As of 5/7/2026, U.S. Treasury Fails were $22.78 billion and U.S. Agency Fails were $4.96 million.
Intraday Commentary From Jim Bianco
Here is a chart of real wages (wage growth minus inflation). Note that March was just 0.2% (y/y wage growth was 0,2% higher than y/y CPI). When the April CPI is out next week, the April update of this chart should turn negative.
The red bars from 2020 to 2022 (again, inflation more than wages) really damaged the public psyche (and particularly the bottom of the K). Is another series of red bars coming, and what will that do to the public’s psyche this time?
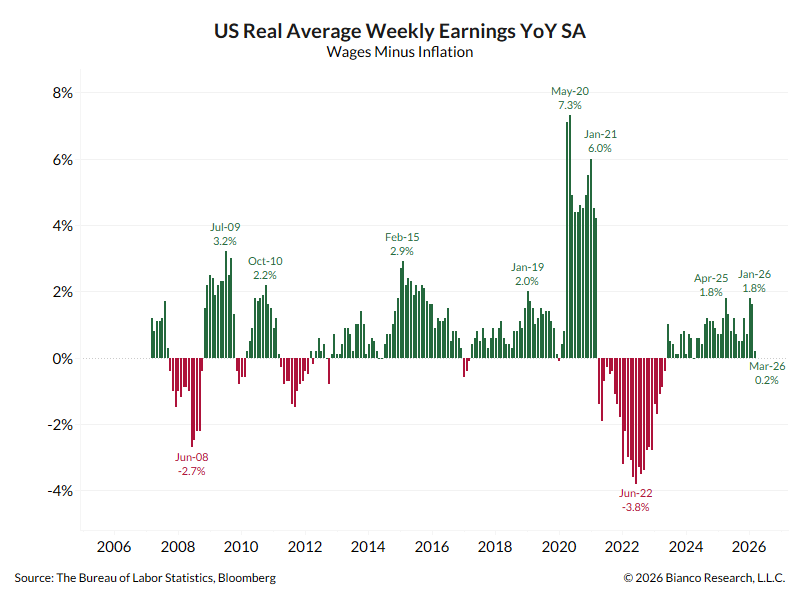
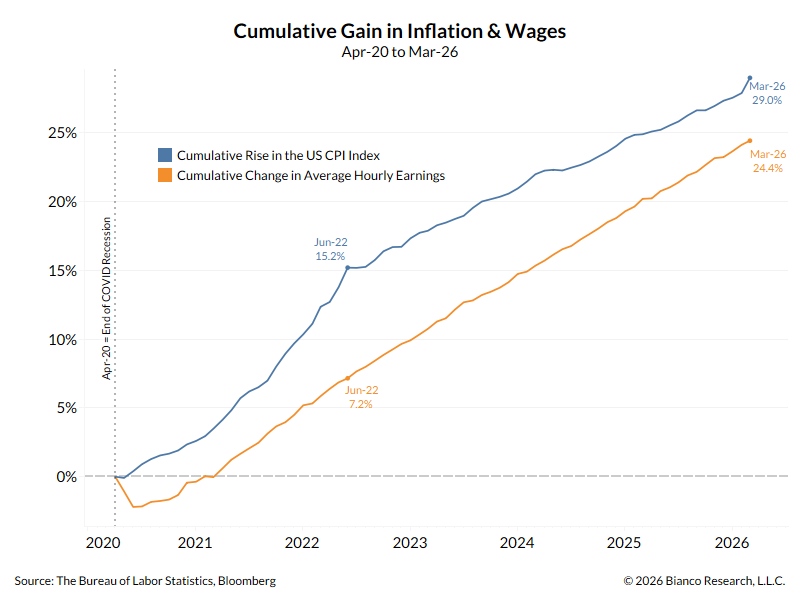
Restated, this chart will widen further, angering an already unhappy public about “affordability.”
In the News
Successful Farming: Fertilizer Prices to Remain High After Iran War as Restart Challenges Expected, Says Nutrien
Business Insider: Read the memo: Cloudflare is laying off 1,100 employees to prepare for ‘the agentic AI era’
Upcoming Economic Releases & Fed Speak