US Treasuries
- Thursday’s range for UST 10y: 4.055% – 4.115%, closing at 4.095%
- Thursday’s range for UST 30y: 4.61% – 4.66%, closing at 4.65%
Bloomberg: Fed Balance-Sheet Decision Cements Funds Rate as Preferred Tool
Intraday Commentary From Bianco Research
Jim Bianco: Repost Bill Gross from last night …
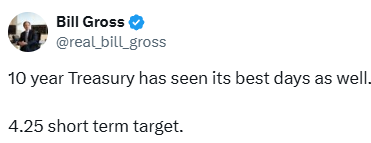
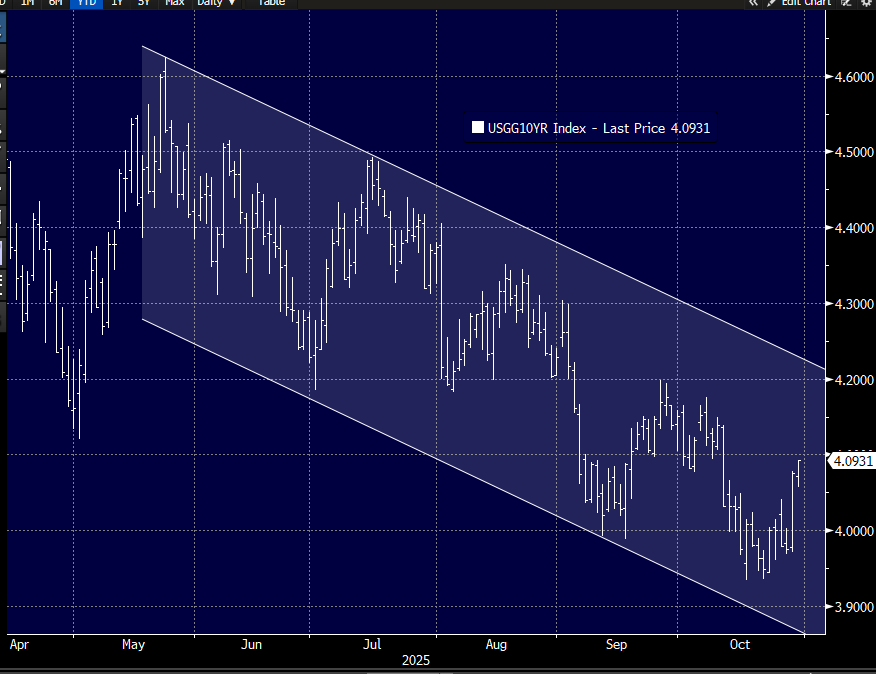
As highlighted on the chart below, the 10-year yield has been in a down channel since hitting 4.62% on May 22.
If Gross is correct and the 10-year yield rises to 4.25% in the short-term, it will exceed its 4.20% “lower high” in late September and mark the first “higher high” in six months.
Should a “higher high” happen, that would mean the highlighted downtrend ended on October 17 at 3.93%.
As I write, the 10-year is trading 4.09% up 11 basis points over the last 24 hours and 11 basis points away from a “higher high.” So, halfway there in less than one day.
Greg Blaha: Another issue that is not helping liquidity…the TGA is now at its largest since May ’22. With the increase in bill issuance, some banks have said the TGA must be larger than the usual $850B target of the last few years in order to ensure the Treasury has adequate operating room. I have seen estimates of $950B as a safe level, but clearly we have already blown past that.
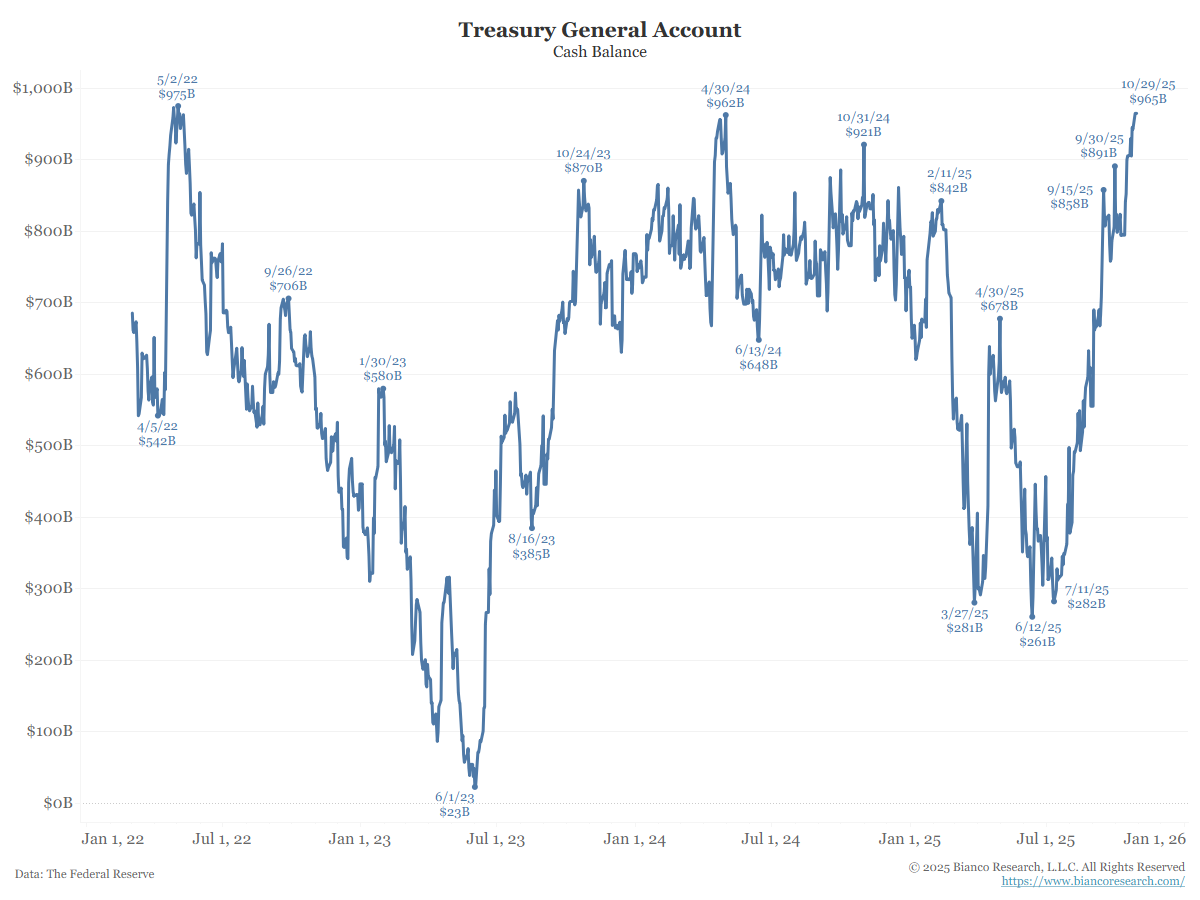
Jim Bianco: Regarding the TGA chart above, the Treasury General Account (TGA) is the Federal government’s “checking account” held at the Federal Reserve. The Federal Government uses it to pay its bills.
In the News
OilPrice: Washington’s $200 Million Move to Rebuild America’s Rare Earth Supply Chain
InsuranceNewsNet: AI & Algorithms: Reshaping portfolio checkups – and outsmarting risk
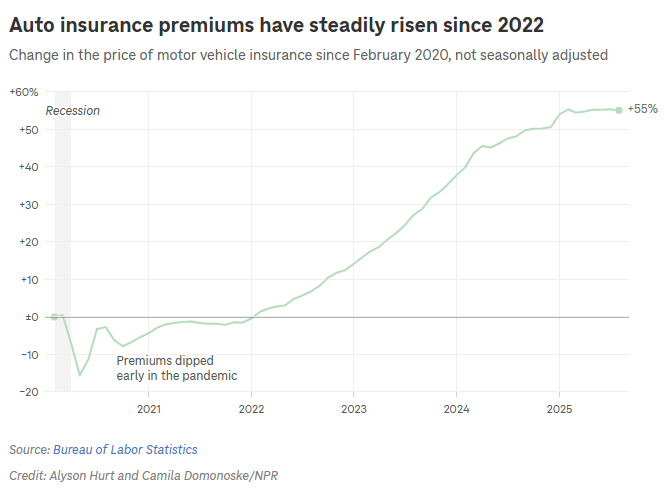
NPR: Why car insurance costs have soared (and what drivers are doing about it)
SupplyChainBrain: GM Temporarily Cuts 5,500 Workers, Citing EV Pressure
Arbor Data Science: EVs – Questions Abound for 2026
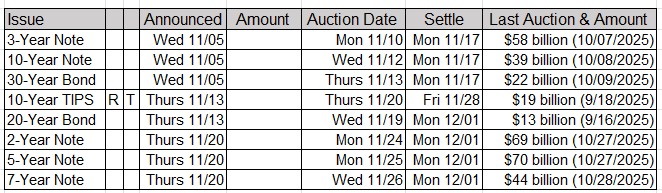
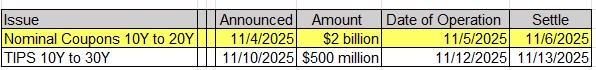
Upcoming US Treasury Supply