US Treasuries
- Friday’s range for UST 10y: 4.06% – 4.11%, closing at 4.09%
- Weekly range for UST 10y: 4.05% – 4.16%
- Friday’s range for UST 30y: 4.67% – 4.715%, closing at 4.70%
- Weekly range for UST 30y: 4.635% – 4.74%
- Fed’s Jefferson: Says Fed Should Proceed Slowly as It Nears Neutral
Jim Bianco Joins Fox Business to discuss the Fed’s Battle Between Inflation & the Job Market, along with the Impacts of the Government Shutdown with Charles Payne
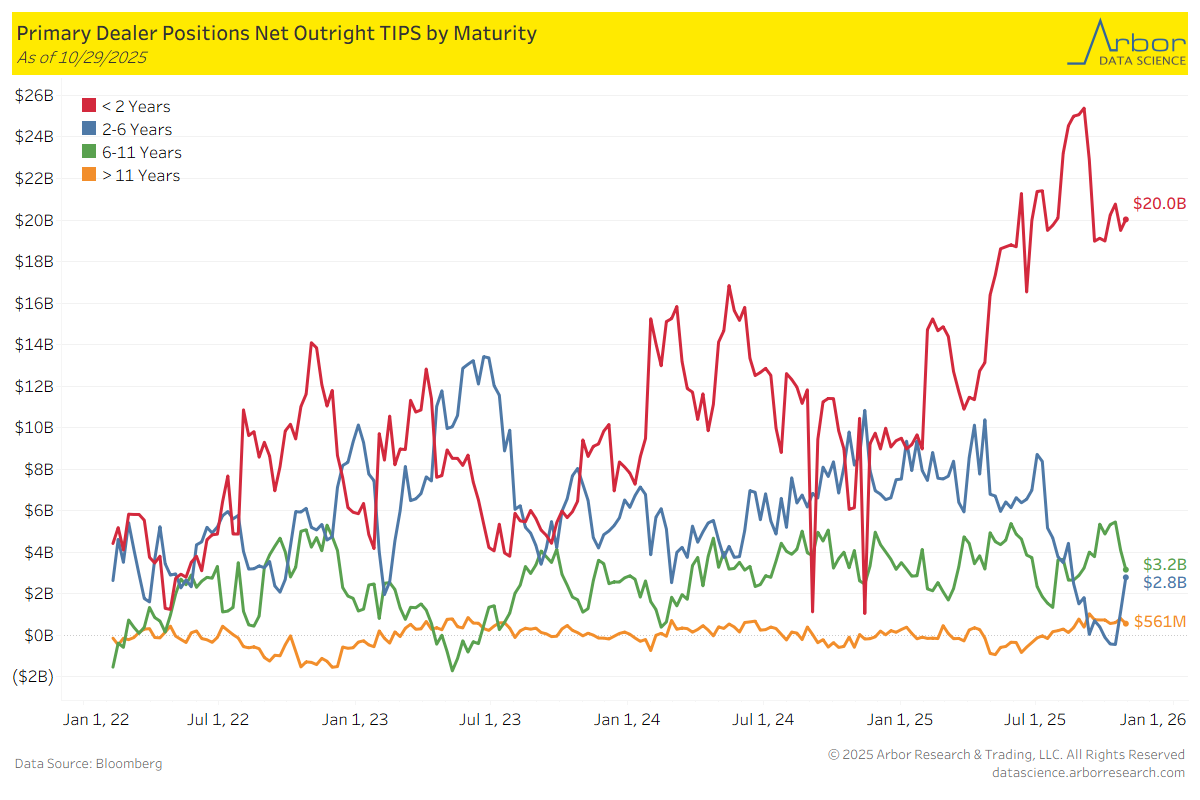
TIPS Returns by Maturity (data through 10/29/25)
Week over Week Changes by Maturity
- < 2 years: $19.5 Bn on 10/22/25 to $20.0 Bn on 10/29/25 = $0.5 Bn
- 2 – 6 years: $1.1 Bn on 10/22/25 to $2.8 Bn on 10/29/25 = $1.7 Bn
- 6 – 11 years: $4.1 Bn on 10/22/25 to $3.2 Bn on 10/29/25 = ($0.9 Bn)
- > 11 years: $807 Mn on 10/22/25 to $561 Mn on 10/29/25 = ($246 Mn)
Intraday Commentary From Bianco Research
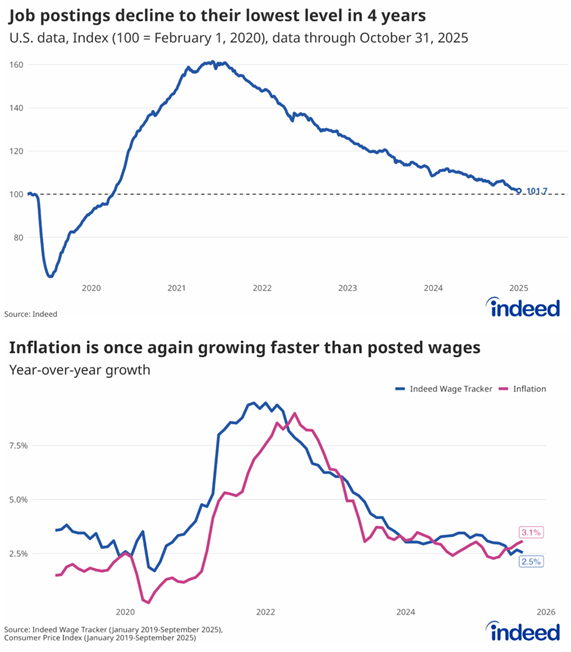
Fed Chairman Jay Powell mouths the words “inflation expectations remain well anchored.”
Yet, the narrative in Washington all week has been that “affordability” explains Tuesday’s election results. And the only explanation for the all-time low in current conditions is affordability. 4.4% unemployment does not explain it, given that 15% in 2020 did not produce readings this bad. 9% inflation in 2022 and the worst of the Great Recession in 2008 saw higher levels of current conditions.
What explains this is that the CUMULATIVE GAINS in prices over the last five years have pushed the bottom 50% to the breaking point. In other words, inflation is unanchored!!! The public wants LOWER prices, NOT A REDUCTION IN THE RATE OF INCREASE. In other words, they want DEFLATION and are voting for politicians who might deliver it, and this wrecks the stock market … so be it.
Rate cuts are inflaming the situation, they are pushing up stock prices when inflation is still above 3% (core CPI). This is driving the public mad with anger when they don’t have enough money to buy the entire grocery list.
The problem is affordability (cumulative inflation), and 3% inflation FIVE YEARS after the shutdown should be viewed as a failure of monetary policy. Instead, the Fed is more worried about a few tenths of a percentage point rise in unemployment and concludes that the stock market needs more rocket fuel.
The problem with this chart is that the red line is too high. Not that the bottom panel blue line is too low.
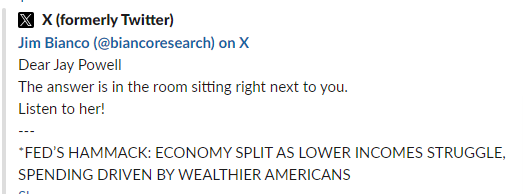
Fortunately, some at the Fed do “get it.”
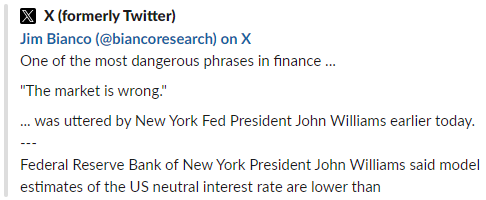
And unfortunately, others do not.
In the News
OilPrice: $60 Oil Undercuts Trump’s ‘Drill, Baby, Drill’ Agenda
FarmPolicyNews: China Buys US Wheat & Sorghum, Ends Some Soybean Import Suspensions
Arbor Data Science: Junior Gold Miners Top Their Senior Counterparts
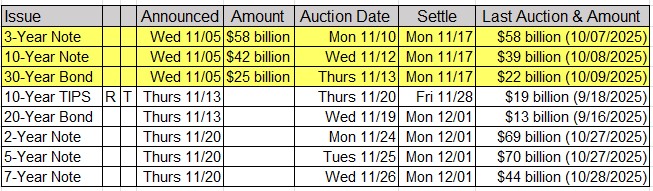
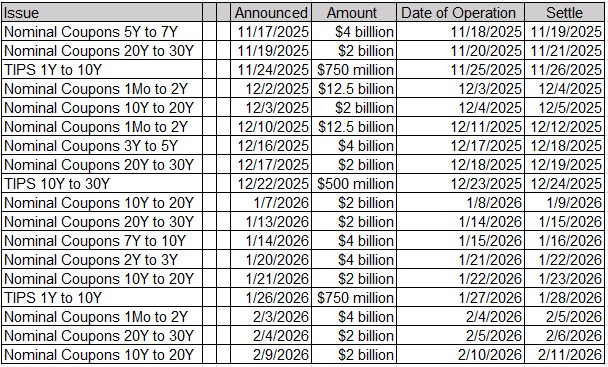
Upcoming US Treasury Supply