US Treasuries
- Tuesday’s UST 10y range:4.37% – 4.44% closing at 4.38%
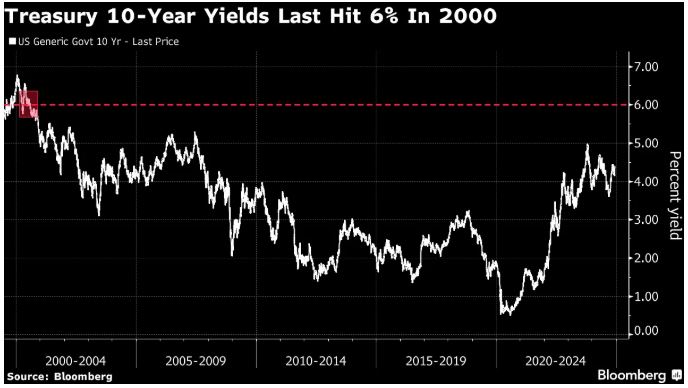
Bloomberg: T.Rowe Raises Prospect of 6% Treasury Yields on Fiscal Risk
Treasury 10-year yields may climb to 6% for the first time in more than two decades as US fiscal woes worsen and Donald Trump’s policies help keep inflation elevated, according to T. Rowe Price.
Bloomberg: TCW Sticks to Bond Wager That’s Lost Money and Spooked Clients
TCW Group Inc.’s Bryan Whalen is sticking to a call that most everyone else on Wall Street abandoned after piling up losses.
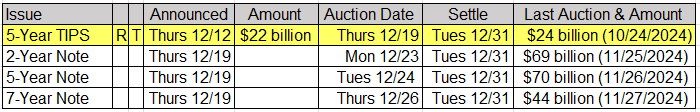
Upcoming US Treasury Supply
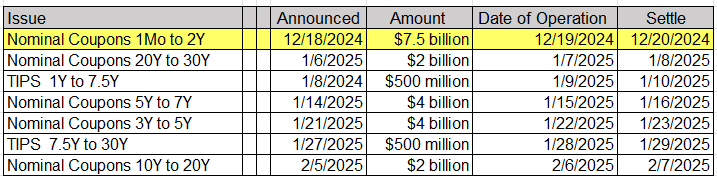
Tentative Schedule of Treasury Buyback Operations
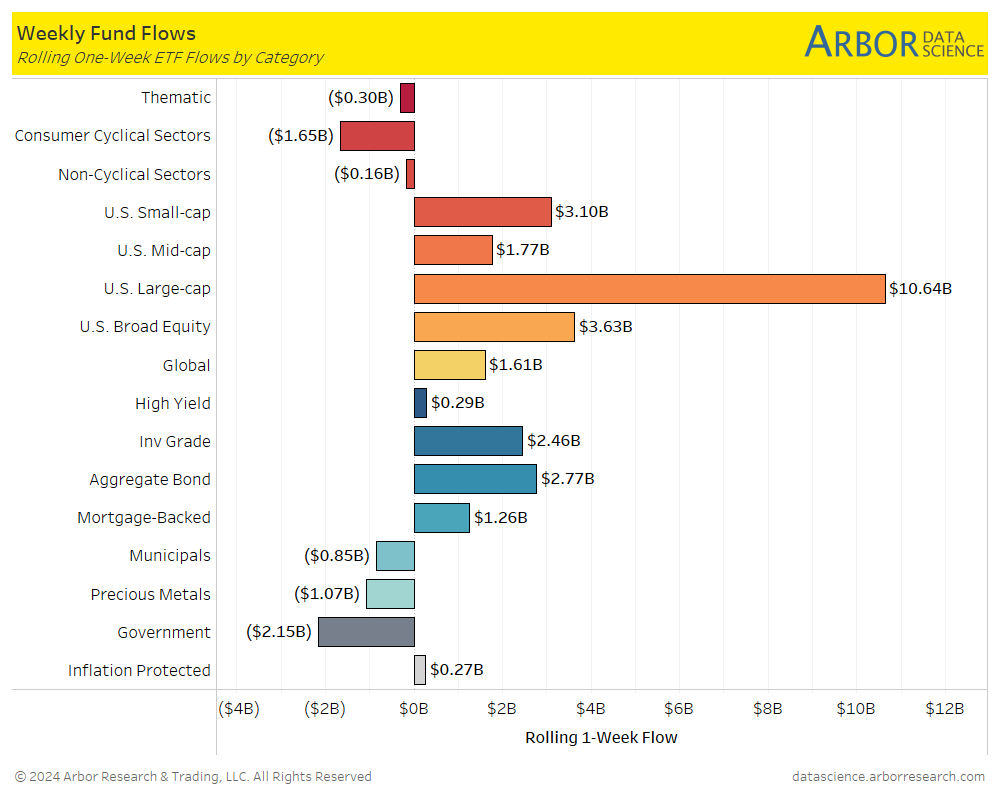
From our Arbor Data Science Desk: Investor Flows – US Large Caps Remain in the Spotlight
Intraday Commentary from Jim Bianco
The top panel (black) is TLT’s price. The bottom panel (red) is TLT’s cumulative flows. The chart starts on March 16, 2022, when the Fed began hiking off zero.
Since that day, money has been pouring into TLT, chasing the return of yield, despite what the price (top panel) did.
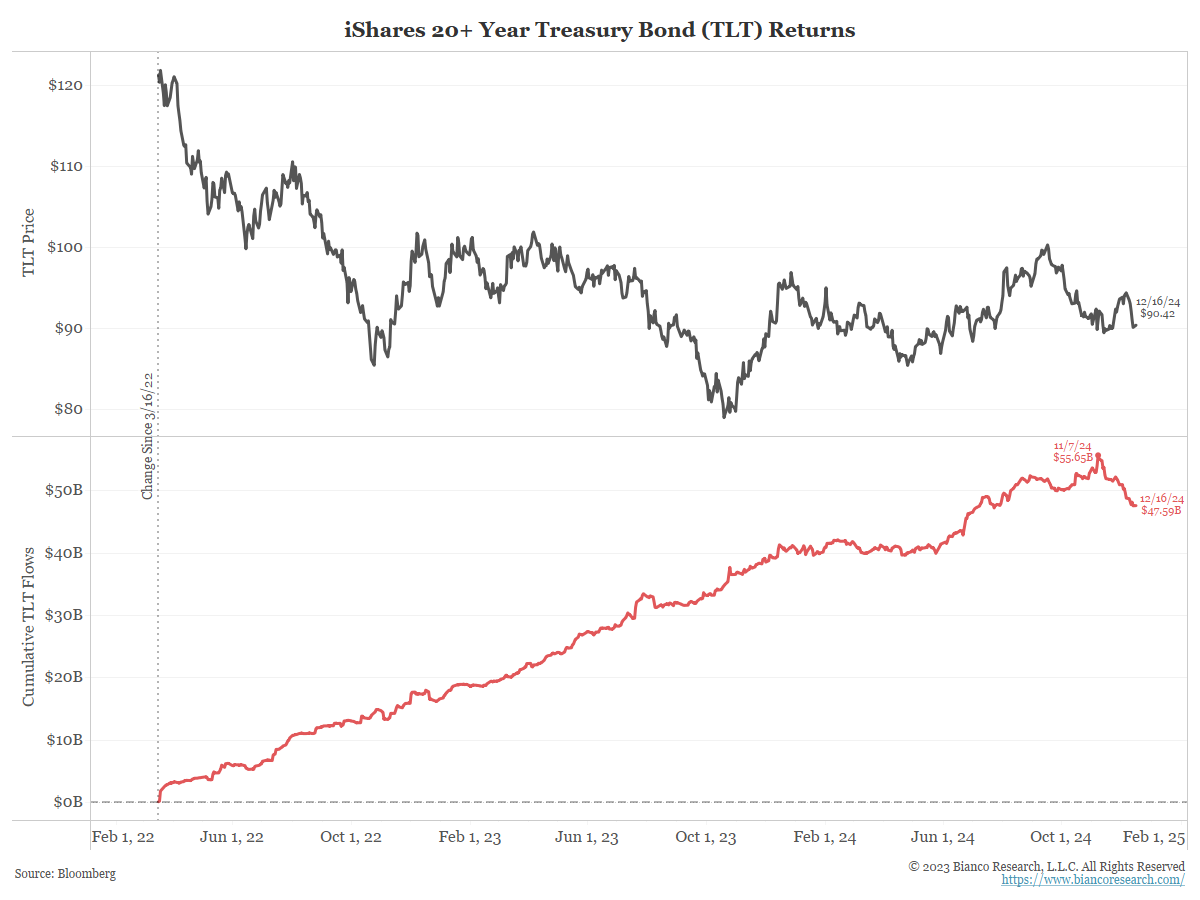
These flows were relentless until they peaked on November 7, two days after the election. Now, money is fleeing “risk-off.” Where is it going? The short answer is “risk-on,” such as equities and crypto.
I see this as a market signal about fiscal policy under the Trump administration (tax cuts, deregulation, and tariffs). It is expected to be a massive boost to the economy and inflation. So, out of bonds and into risk assets.
Is this a realistic assessment of what is coming or part of an unsustainable market mania (both the mad risk into “risk-on” and out of “risk-off?”
The normal answer to my question above is that it is part of an unsustainable market move, probably based on unrealistic expectations.
But I suspect the answer I’ll get is some version of “this time is different,” and this is the correct thing to do.
In Other News…
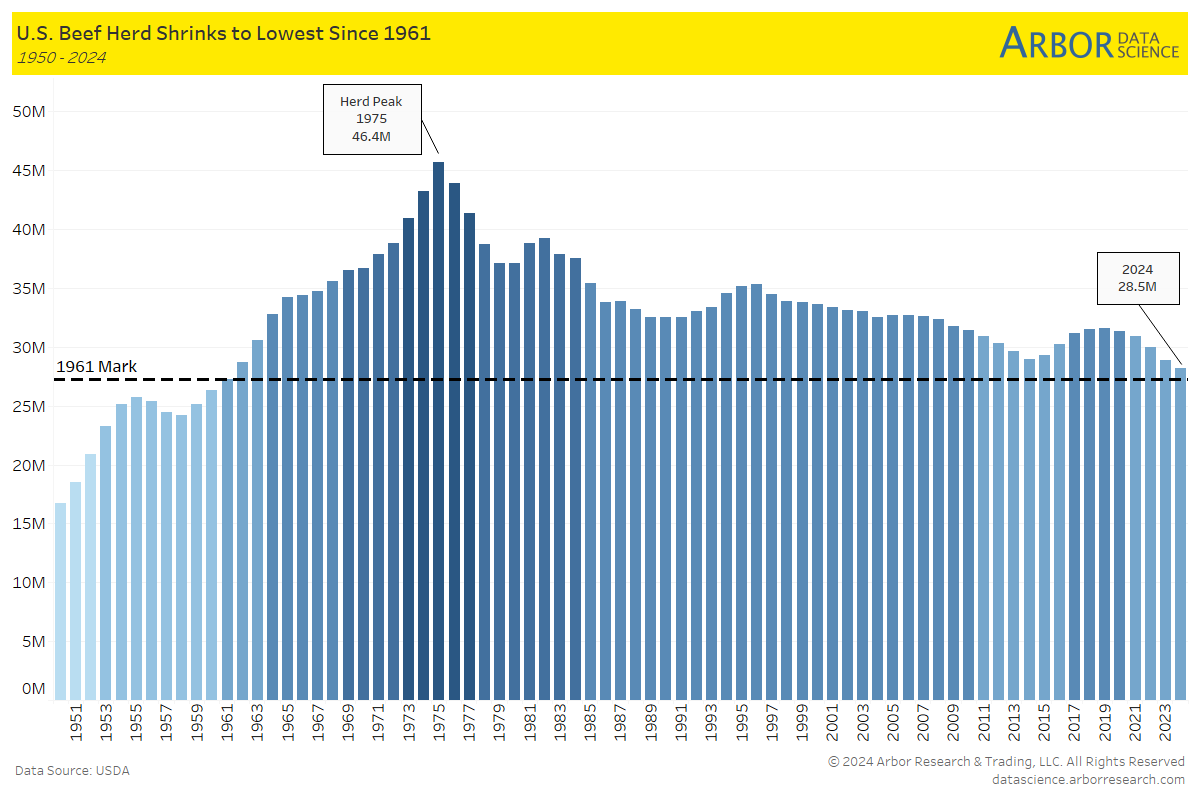
ZeroHedge: Bullish Cattle Bets Soar As US Herd Crisis Sparks Breakout To Record High Price
Institutional investors are increasing bullish bets on live cattle futures, pushing them to their highest levels in five years, as America’s herd size dwindles to its lowest point in more than six decades.
In depth coverage from Arbor Data Science last week: Where’s the Beef? by Sam Rines
OilPrice: Goldman Sachs: Huge Spare Capacity Weighs on Oil Prices
Spare oil production capacity at the highest quartile in history is weighing on Brent crude prices, and time spreads have looked undervalued since the summer, according to Goldman Sachs.
MPA: Commercial real estate turmoil puts regional banks under pressure
Banks with less than $100 billion in assets modified 0.32% of their CRE loans in the first nine months of 2024, up from 0.1% in the first half of the year, according to a Moody’s Ratings report. However, smaller banks still trail medium-sized institutions (1.93%) and larger lenders (0.79%) in confronting declining commercial property prices.
USA Today: Seven reasons why Americans pay more for health care than any other nation
Americans spend far more on health care than anywhere else in the world but we have the lowest life expectancy among large, wealthy countries.
Upcoming Economic Releases & Fed Speak
- 12/18/2024 at 7:00am EST: MBA Mortgage Applications
- 12/18/2024 at 8:30am EST: Building Permits & Housing Starts
- 12/18/2024 at 8:30am EST: Housing Starts MoM & Building Starts MoM & Current Account Balance
- 12/18/2024 at 2:00pm EST: FOMC Rate Decision
- 12/18/2024 at 2:00pm EST: Fed Interest on Reserve Balances Rate
- 12/19/2024 at 8:30am EST: GDP Annualized QoQ & Personal Consumption
- 12/19/2024 at 8:30am EST: GDP Price Index & Core PCE Price Index QoQ & Philadelphia Fed Business Outlook
- 12/19/2024 at 8:30am EST: Initial Jobless Claims & Initial Jobless Claims
- 12/19/2024 at 10:00am EST: Leading Index & Existing Home Sales & Existing Home Sales MoM
- 12/19/2024 at 11:00am EST: Kansas City Fed Manf. Activity
- 12/19/2024 at 4:00pm EST: Total Net TIC Flows & Net Long-term TIC Flows
- 12/20/2024 at 7:30am EST: Fed’s Daly Appears on Bloomberg TV
- 12/20/2024 at 8:30am EST: Personal Income & Personal Spending & Real Personal Spending
- 12/20/2024 at 8:30am EST: PCE Price Index MoM & PCE Price Index YoY
- 12/20/2024 at 8:30am EST: Core PCE Price Index MoM & Core PCE Price Index YoY
- 12/20/2024 at 10:00am EST: U. of Mich. Sentiment & U. of Mich. Current Conditions & U. of Mich. Expectations
- 12/20/2024 at 10:00am EST: U. of Mich. 1-Yr Inflation & U. of Mich. 5-10 Inflation
- 12/20/2024 at 10:00am EST: Kansas City Fed Services Activity
- 12/23/2024 at 8:30am EST: Chicago Fed Nat Activity Index
- 12/23/2024 at 10:00am EST: Conf. Board Consumer Confidence/ Present Situation / Expectations
- 12/24/2024 at 8:00am EST: Building Permits & Building Permits MoM
- 12/24/2024 at 8:30am EST: Philadelphia Fed Non-Manufacturing & Durable Goods Orders & Durables ex Transportation
- 12/24/2024 at 8:30am EST: Cap Goods Orders Nondef Ex Air & Cap Goods Ship Nondef Ex Air
- 12/24/2024 at 10:00am EST: New Home Sales & New Home Sales MoM
- 12/24/2024 at 10:00am EST: Richmond Fed Manufact. Index & Richmond Fed Business Conditions
Dealer Positions ($’s in millions of dollars)
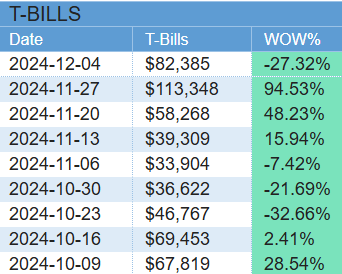
- Dealer positions in T-Bills (as of 12/04) were down 30.96bln @82.38bln
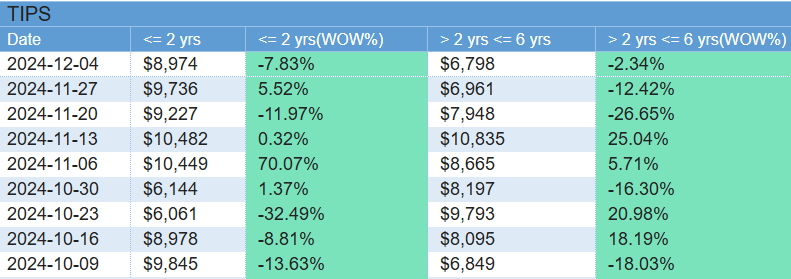
- Dealer positions <2yrs TIPS (as of 12/04) were down 762mln @8.97bln.
- Dealer positions in 2-6yrs TIPS (as of 12/04) were down 163mln @7.94bln.
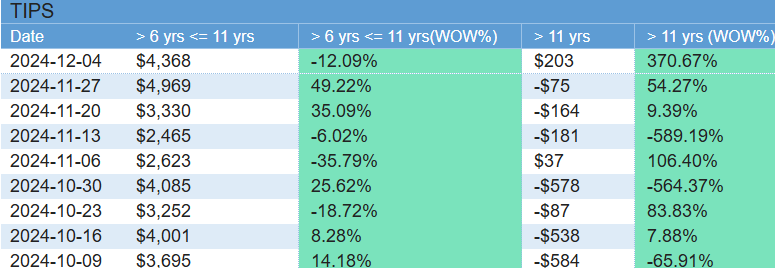
- Dealer positions in 6-11yrs TIPS (as of 12/04) were up 601mln @4.36mln.
- Dealer positions > 11yrs TIPS (as of 12/04) were up 278mln @203mln.
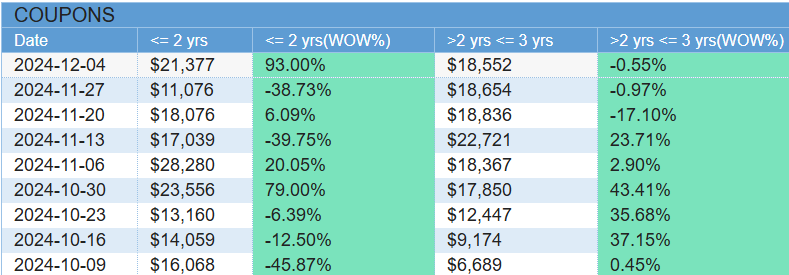
- Dealer positions in < 2yrs Coupons (as of 12/04) were up 10.30bln @21.37bln.
- Dealer positions > 2yrs and < 3yrs Coupons (as of 12/04) were down 102mln @18.55bln.
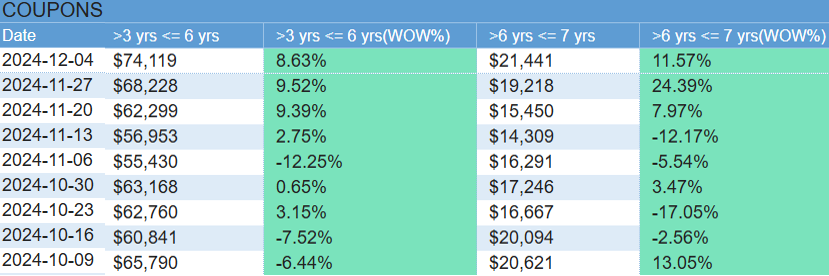
- Dealer positions in > 3 years and< 6yrs Coupons (as of 12/04) were up 5.89bln @74.11bln.
- Dealer positions > 6yrs and < 7yrs Coupons (as of 12/04) were up 2.22bn @21.44bln.
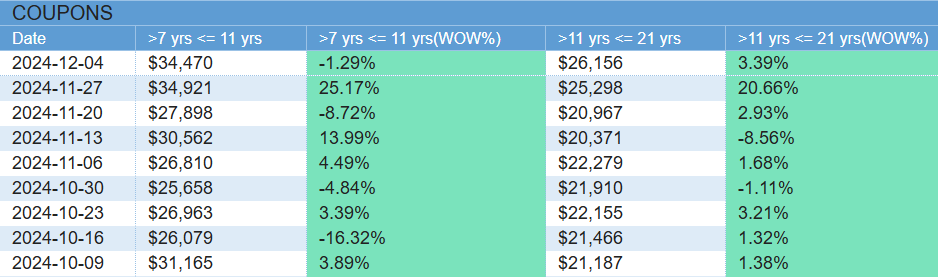
- Dealer positions in > 7 years and< 11yrs Coupons (as of 12/04) were down 451mln @34.47bln.
- Dealer positions > 11yrs and < 21yrs Coupons (as of 12/04) were up 858mln @26.15bln.
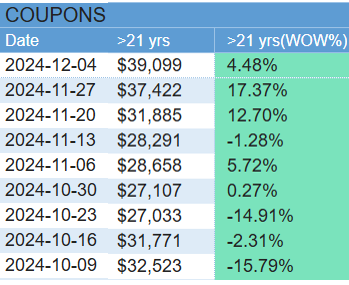
- Dealer positions in > 21 years Coupons (as of 12/04) were up 1.67bln @39.09bln.