A week from today: *SUPREME COURT SAYS FEB. 20 TO BE OPINION DAY AMID TARIFF WAIT
And if not, Feb 20 …*SUPREME COURT ALSO SETS FEB. 24 AND 25 AS DAYS FOR OPINIONS
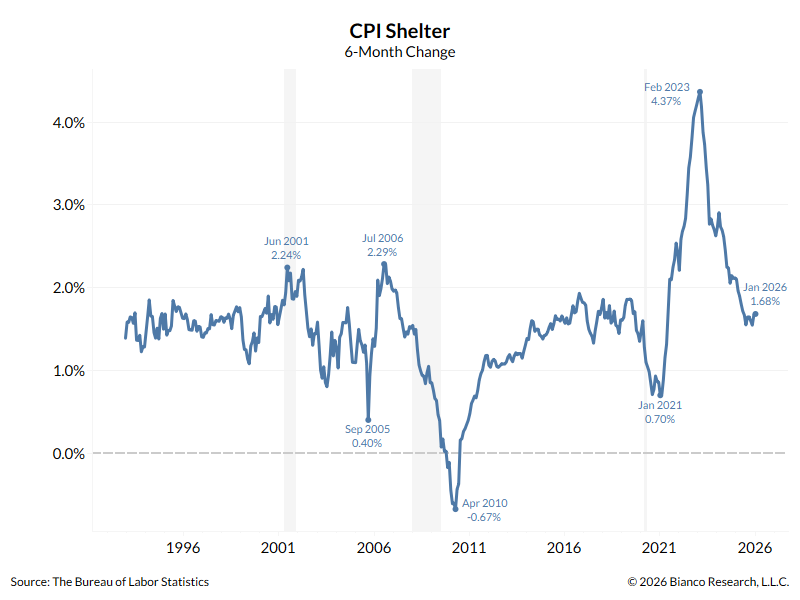
Shelter is worth watching, as it has been the major force behind the fall in CPI since the Covid peaks. Maybe too early to tell, but it appears to have stopped declining on a 3-month and 6-month basis.
Note, however, this happened twice in the past couple years – both in Jan/Feb of 2024 and 2025.
Colleague:
When will the tariffs create the inflation? Have we rolled over? Or, did we already experience it when CPI went from 2.3% to 3.0%…last April to Sept?
Jim Bianco:
Remember, there was no October CPI (shutdown); they “carried forward” the September number, meaning they assumed 0.0% inflation (except for a few things they could get, like gasoline and used cars). This month’s decline was driven by a larger-than-expected drop in energy (read: gasoline), which fell 1.47% in January. So, when every state legislature and Congress is breathlessly trying to deal with soaring electricity prices, the BLS tells us energy inflation is collapsing. Go figure.
Bottom line, this report is a complete mess right now. You can read whatever you want into it.
OER was zero in October. It is a six-month survey. That zero rolls off in April. The rest of the zeros roll off in October. Let’s see what inflation says after the “missing” zeros roll off on April (OER) and October (everything else). If this report was 0.2% higher, it would have mattered, so October at zero does matter.
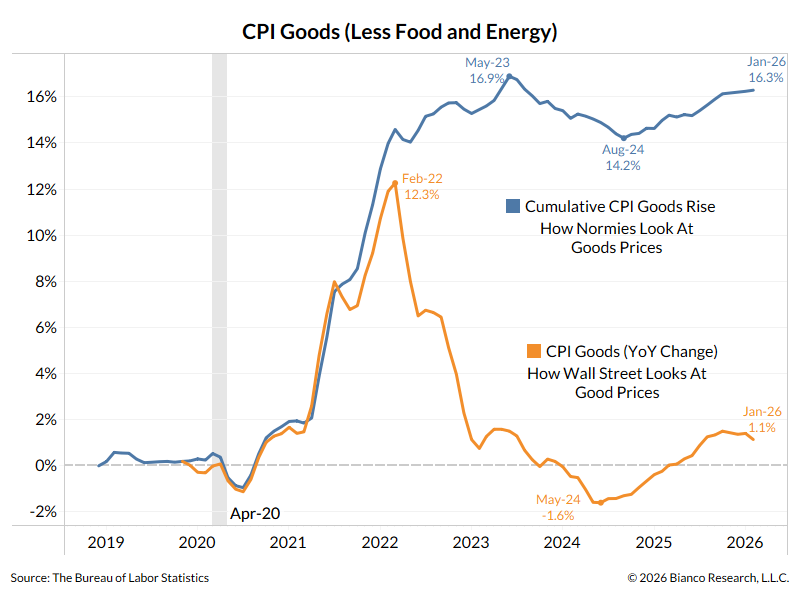
Regarding Tariffs, here is CPI Good (less food and Energy) measured two different ways. Cumulative (blue), which is how Normies view the world. Year-over-Year (Orange), which is how economists see the world. Both are right.
Buy good prices are rising, and we still have a few months of “pre-Liberation Day” good CPI measures to roll off.
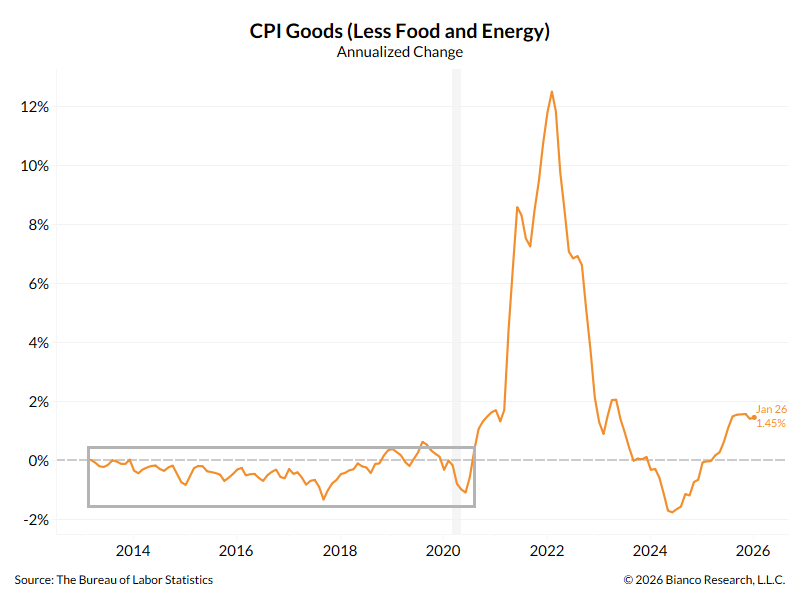
Answering the question: Are goods prices rising 1.45% a year a low number?
The gray box is 2012 to 2021. It was negative most of this period. Now it is above 1%. Tariffs are in the CPI report.
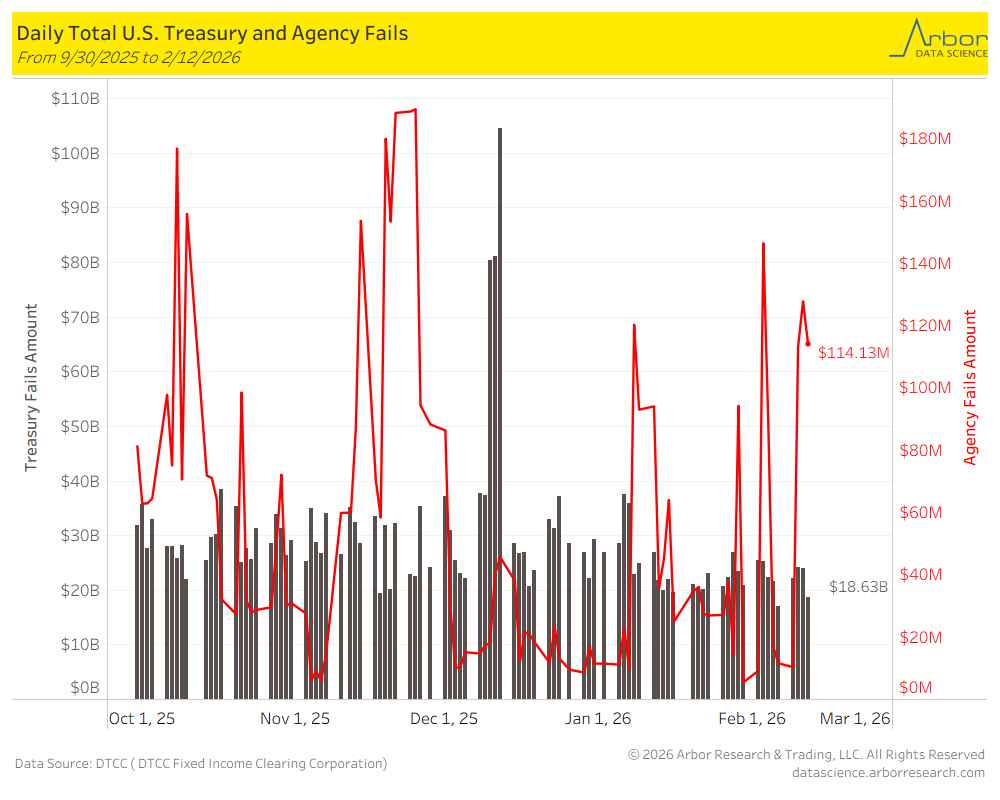
US Trade Fails
As of 2/12/2026, U.S. Treasury Fails were $18.63 billion and U.S. Agency Fails were $114.13 million.
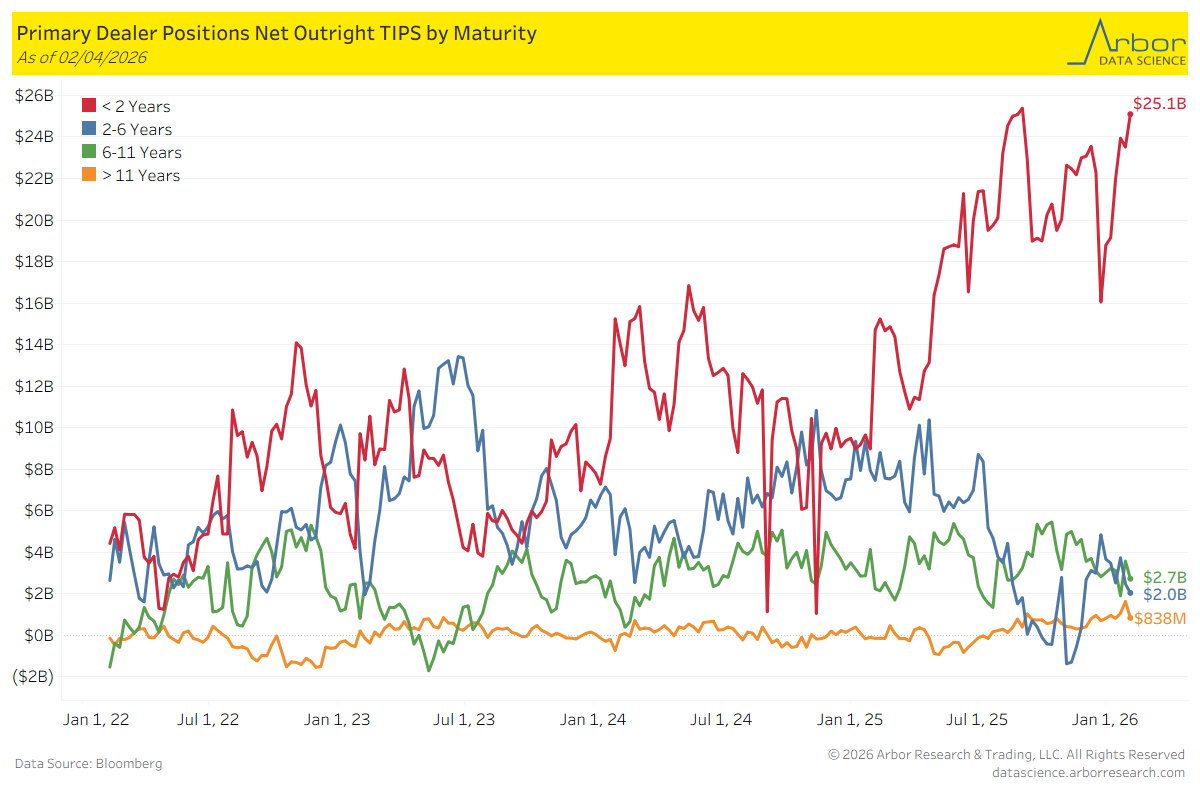
TIPS by Maturity (data through 2/04/2026)
Week over Week Changes by Maturity
< 2 years:$23.5 Bn on 1/28/2026 to $25.1 Bn on 2/04/2026 = $1.6 Bn
2 – 6 years:$2.5 Bn on 1/28/2026 to $2.0 Bn on 2/04/2026 = ($0.5 Bn)
6 – 11 years:$3.6 Bn on 1/28/2026 to $2.7 Bn on 2/04/2026= ($0.9 Bn)
> 11 years:$1.6 Bn on 1/28/2026 to $838 Mn on 2/04/2026 = ($797 Mn)