US Treasuries
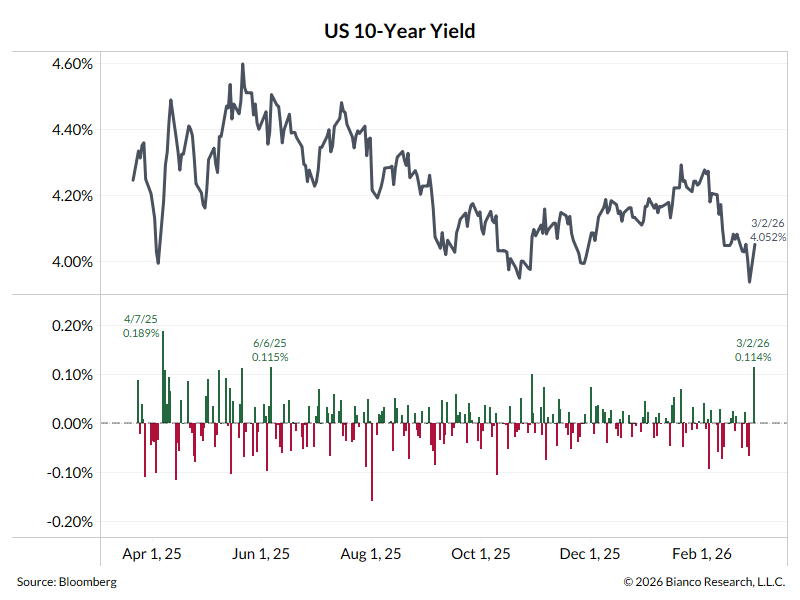
- UST 10s on Monday closed at 4.04%
- 1st weekly support at 4.035% / 4.06% 56% to hold on the week
- 2nd weekly support at 4.11% / 4.125% 69% to hold on the week
- –> 1st monthly support at 4.065% / 4.09% 77% to hold on the week [this has held for 2 months]
- –> 2nd monthly support at 4.14% / 4.16% 90% to hold on the week
- 1st weekly resist at 3.91% / 3.92% 90% to hold on the week
- 2nd weekly resist at 3.825% / 3.84% 50% to hold on the week
- –> 1st monthly resist at 3.83% / 3.855% 55% to hold on the week
Conference Call Friday, March 06, 2026, Featuring Jim Bianco
Remember that once CPI and PPI are released, the street is VERY ACCURATE at taking that raw data and re-weighting it for PCE. PCE uses the same raw inputs as CPI and PPI (some PPI categories are included in PCE), but with different weightings.
I plugged in 3.1% for January YoY core PCE into the chart below, and it shows YoY core PCE is now running 0.6% ABOVE YoY Core CPI. It is very close to a 40+ year extreme.
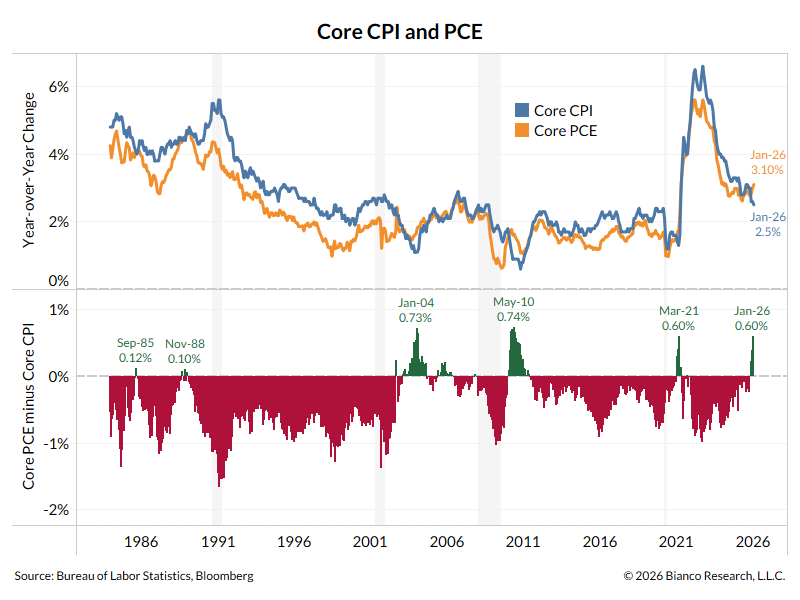
The joke for decades was that the Fed preferred PCE over CPI simply because PCE was typically a lower inflation measure (red bars, bottom panel). The only time this spread flipped to positive (green bars, bottom panel) was in the aftermath of a recession, which was attributed to distortions from the previous recession.
Now this spread is flipping again, meaning the Fed’s preferred inflation measure is getting WORSE relative to the public’s preferred inflation measure (CPI).
This is why the Fed is adamant about not cutting rates anytime soon. The measure they watch is going north, as the measure the public watches is going south.
Question? Does the Fed now abandon decades of precedent with its PCE inflation target of 2% because it has become inconvenient? It would not be the first time they have done this, especially around inflation measures (see how quickly they abandoned the University of Michigan inflation expectations measures the second they became inconvenient).
If ISM is supposed to tell us about the economy, are the recent readings north of 50 (top panel) signaling big jumps in GDP (bottom panel)?
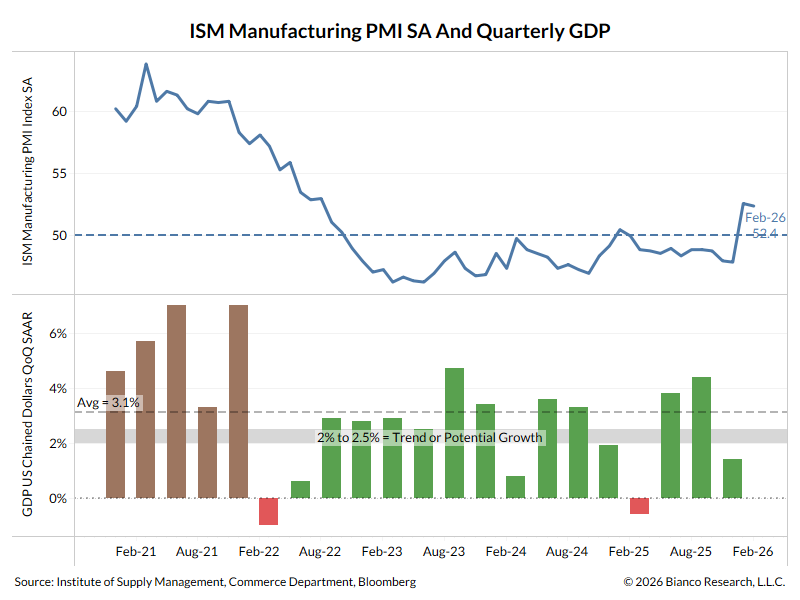
10-year yields … between the ISM and crude oil, up 11.4 bps today. Effectively equaling the June 2025 move, or the biggest one-day yield rise in 8 months, and 1-tick away from being the largest one-day yield rise since early April 2025 (Liberation Day).
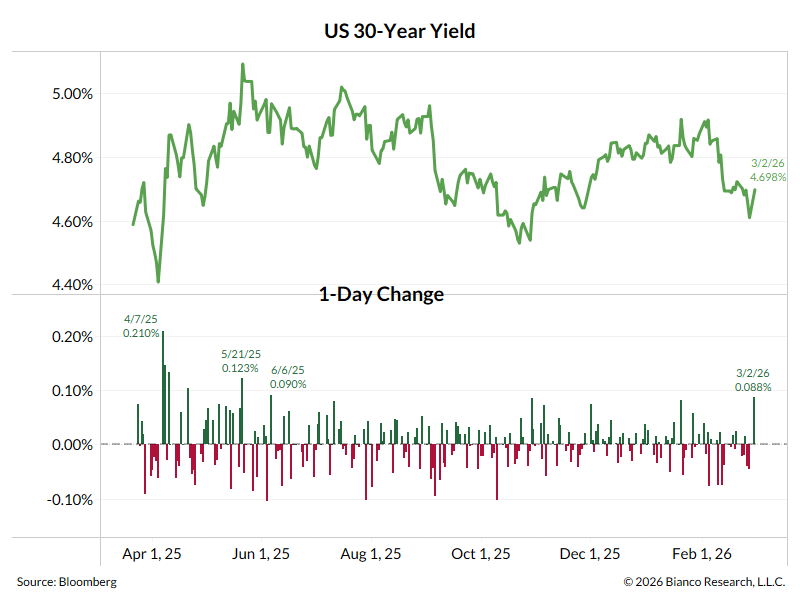
30-year yield version of the chart
2-year yield version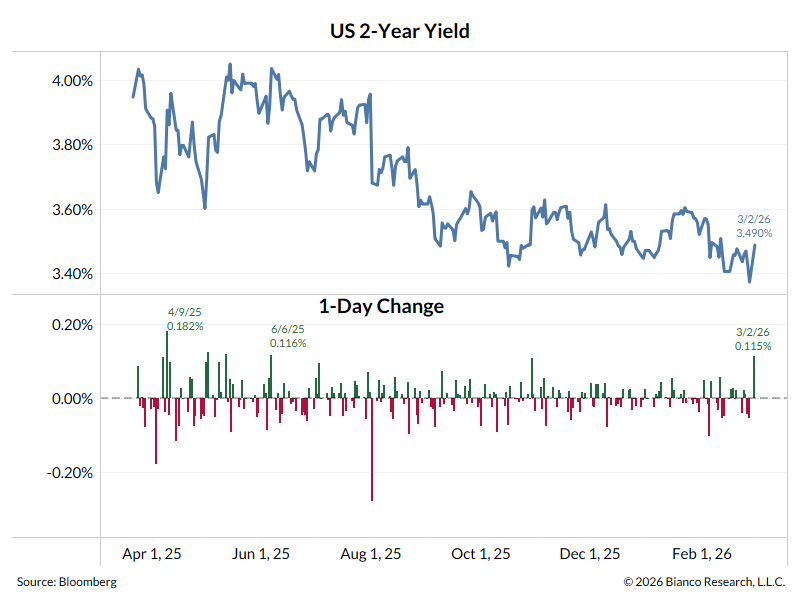
In the News
OilPrice: How China’s Rare Earth Ban Backfired into a U.S. Tech Breakthrough
ZeroHedge: Where Food Inflation Is Expected To Hit Hardest In 2026
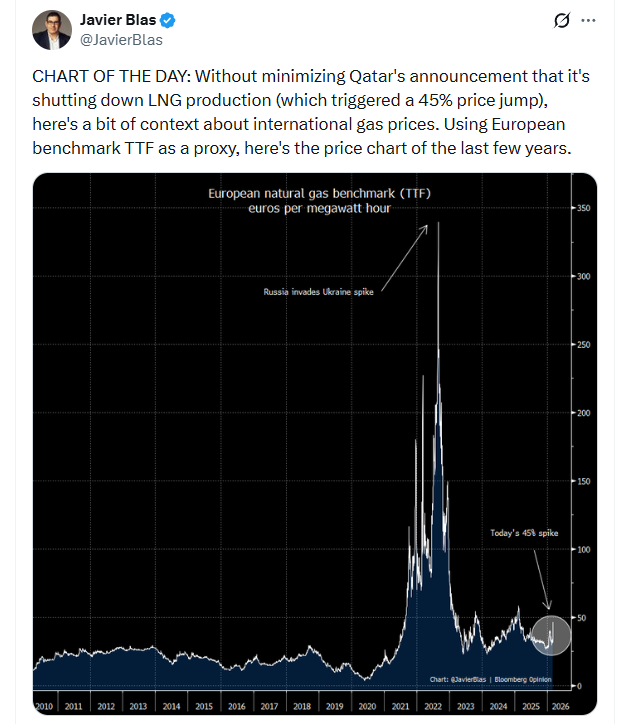
Javier Blas on X:
Bloomberg: Iran War Snarls Key Global Hub for Fertilizer Supplies
SuccessfulFarming: The U.S. Farm Machinery and Equipment Market: Sales, Inventories, and Tariff Headwinds
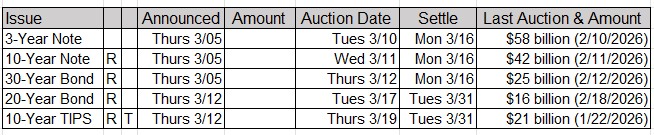
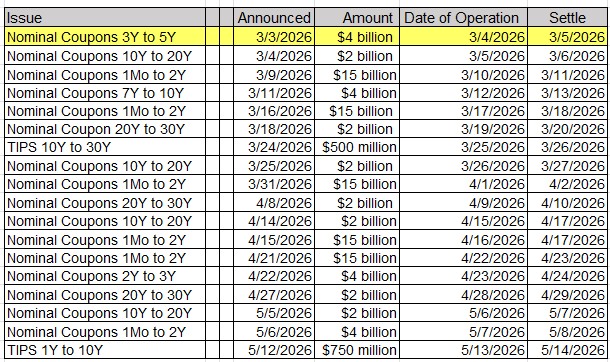
Upcoming US Treasury Supply
Upcoming Economic Releases & Fed Speak
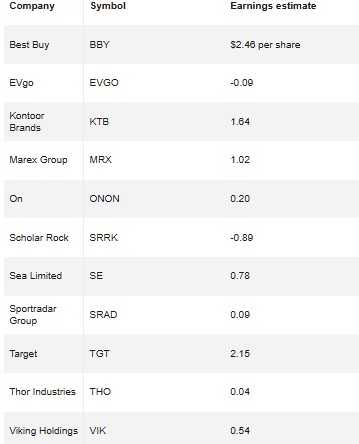
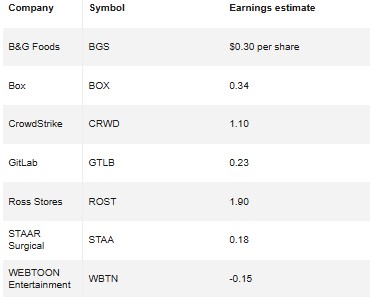
Noteworthy After-the-Close Earnings Releases