10s closed on Friday at 4.43. The range for the week was: 4.30 – 4.48
1st daily support is 4.475/4.49 56% to hold
2nd daily support is 4.54/4.55
1st weekly support at 4.51/4.53 57% to hold
2nd weekly support at 4.65/4.67 90% to hold
1st quarterly support at 4.425/4.495 Has held for 4 quarters
1st daily resistance is 4.385/4.40
2nd daily resistance is 4.345/4.36
1st weekly resistance at 4.31/4.33 86% to hold
2nd weekly resistance at 4.23/4.25 90% to hold
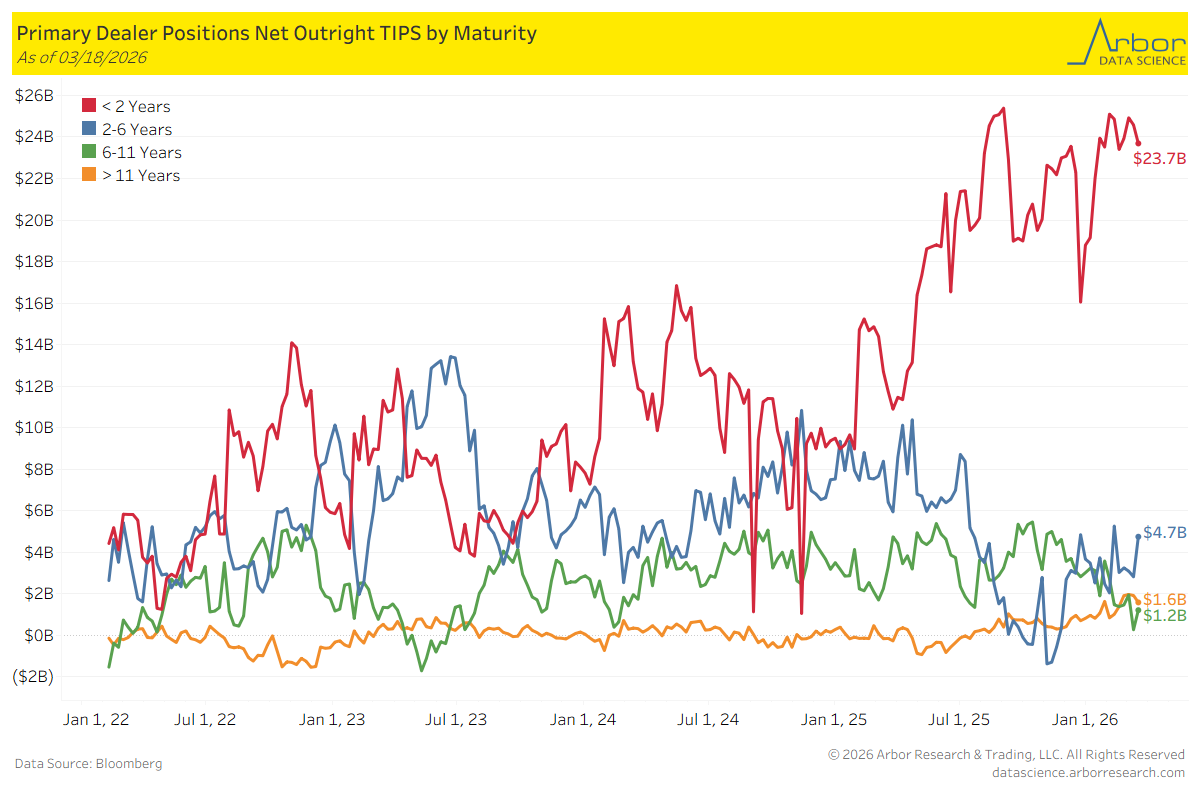
TIPS by Maturity (data through 3/18/2026)
Week over Week Changes by Maturity
< 2 years:$24.6 Bn on 3/11/2026 to $23.7 Bn on 3/18/2026 = ($0.9 Bn)
2 – 6 years:$2.8 Bn on 3/11/2026 to $4.7 Bn on 3/18/2026 = $1.9 Bn
6 – 11 years:$0.3 Bn on 3/11/2026 to $1.2 Bn on 3/18/2026= $0.9 Bn
> 11 years:$1.9 Bn on 3/11/2026 to $1.6 Bn on 3/18/2026 = ($0.3 Bn)
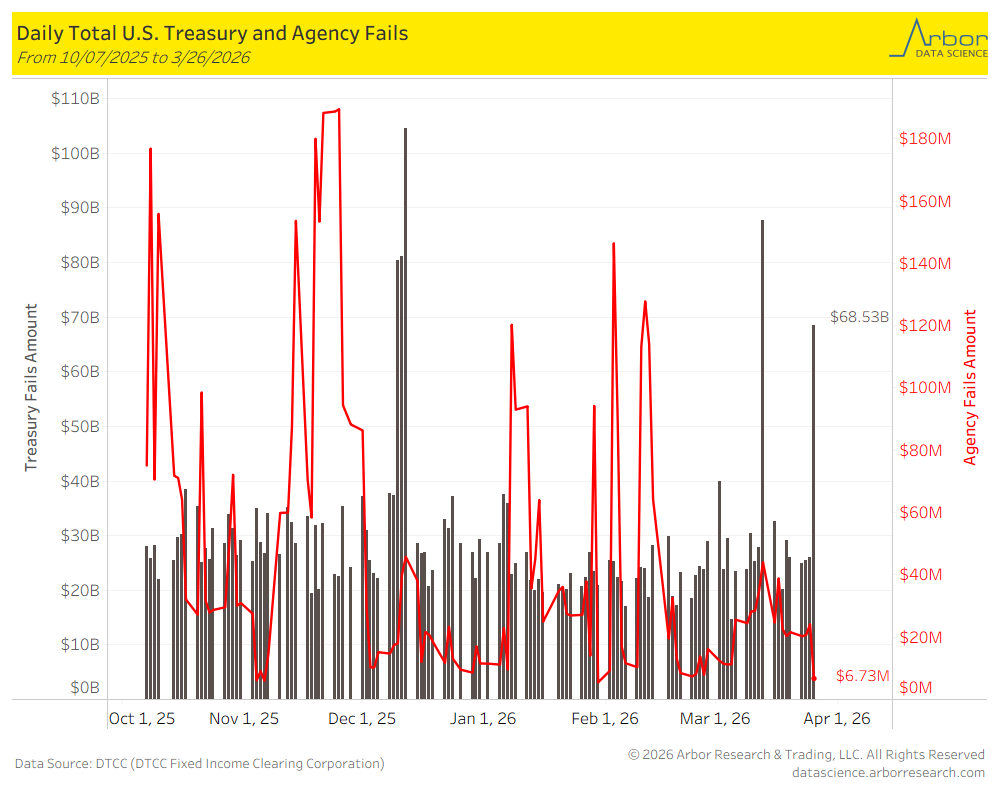
US Treasury Trade Fails
As of 3/26/2026, U.S. Treasury Fails were $68.53 billion and U.S. Agency Fails were $6.73 million.
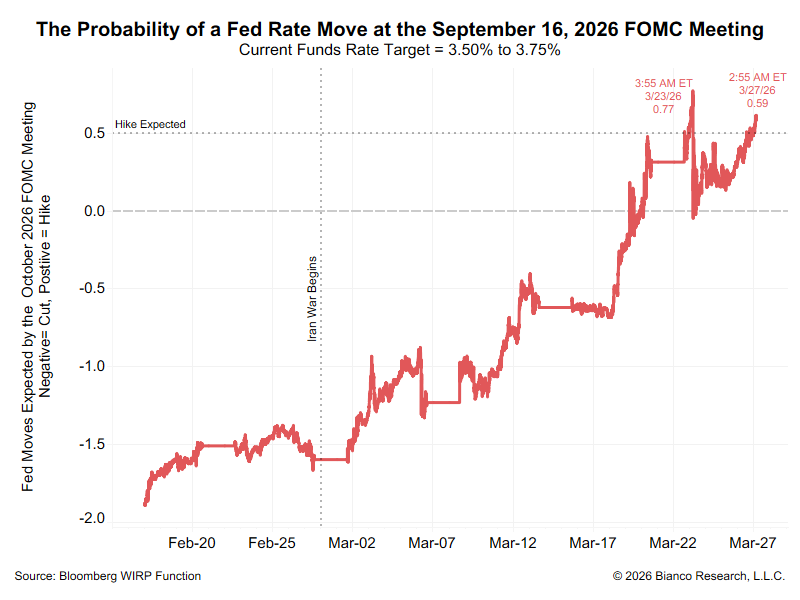
Intraday Commentary From Jim Bianco
Now a September rate HIKE is one the table.
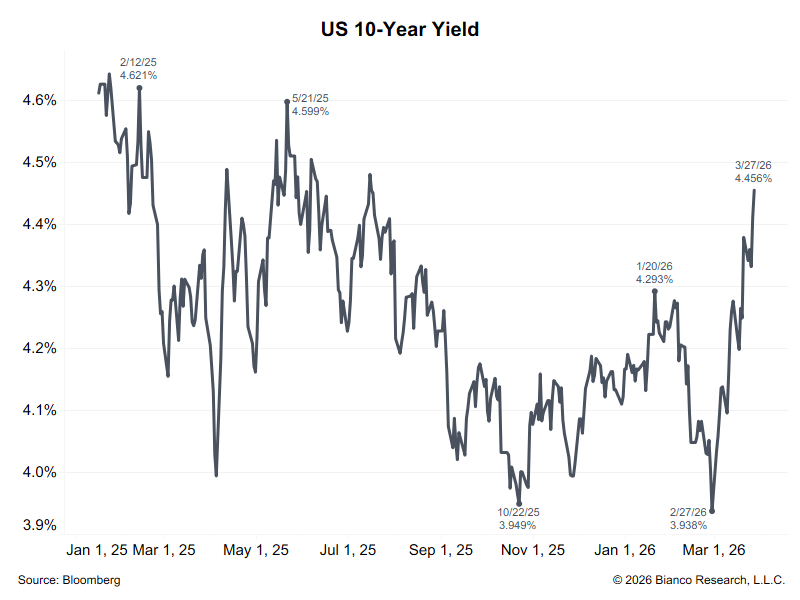
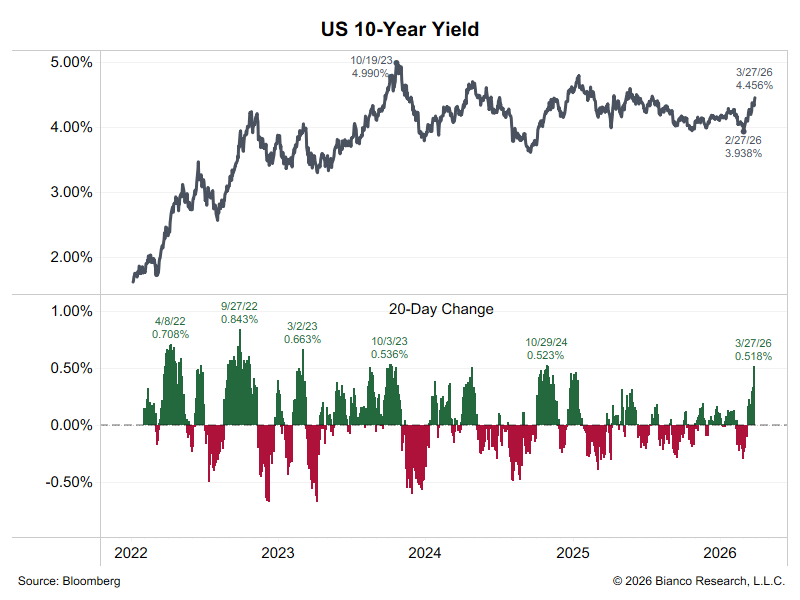
10-year yield now 4.46%, highest since May
Today is the 20th trading day since the war began. As the bottom panel shows, the 10-year yield is up 51 bps.
If it rises another 2 bps, it will be the biggest 20 day rise in the 10-year yield in 3 years (SVB failure in March 2023)
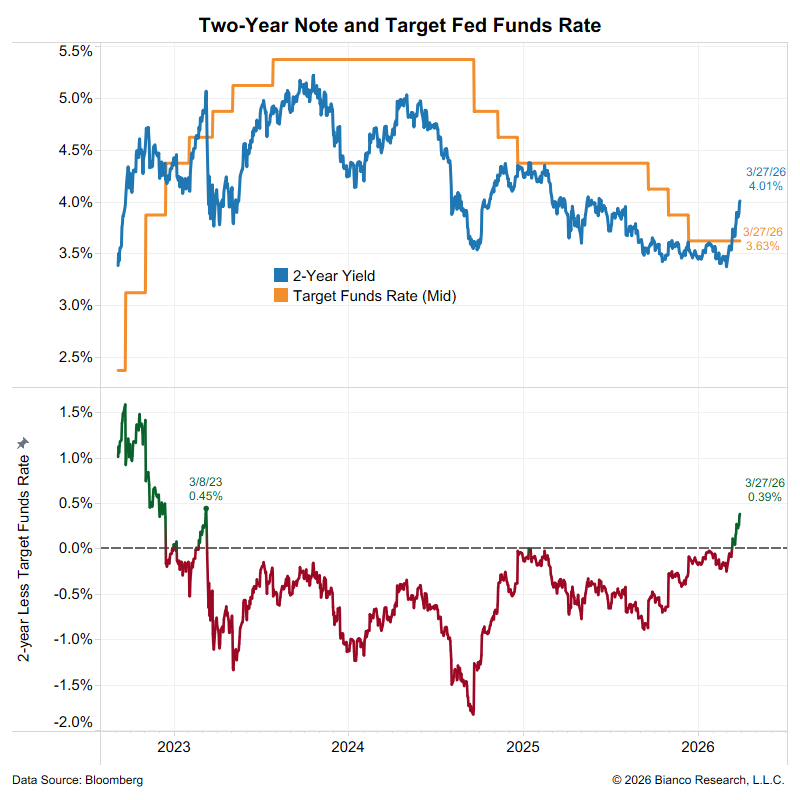
Consistent with the fed fund futures pricing above is the 2-year note. As this chart shows, it just topped 4% (blue) and is trading at 39 bps above the target funds rate (bottom panel).
Typically, the 2-year note yield trades this far above the target funds rate (orange) when the Fed is hiking … and the fed fund futures market is pricing the first hike in 6 months.