US Treasuries
- 1st daily support is 4.335/4.34 61% to hold
- 2nd daily support is 4.38/4.39 67% to hold
- 1st weekly support at 4.38/4.405 70% to hold
- 1st monthly support at 4.465/4.495 64% to hold
- 1st daily resistance is 4.27/4.28 74% to hold
- 2nd daily resistance is 4.245/4.25 50% to hold
- 1st weekly resistance at 4.215/4.25
- 1st monthly resistance at 4.095/4.125 90% to hold
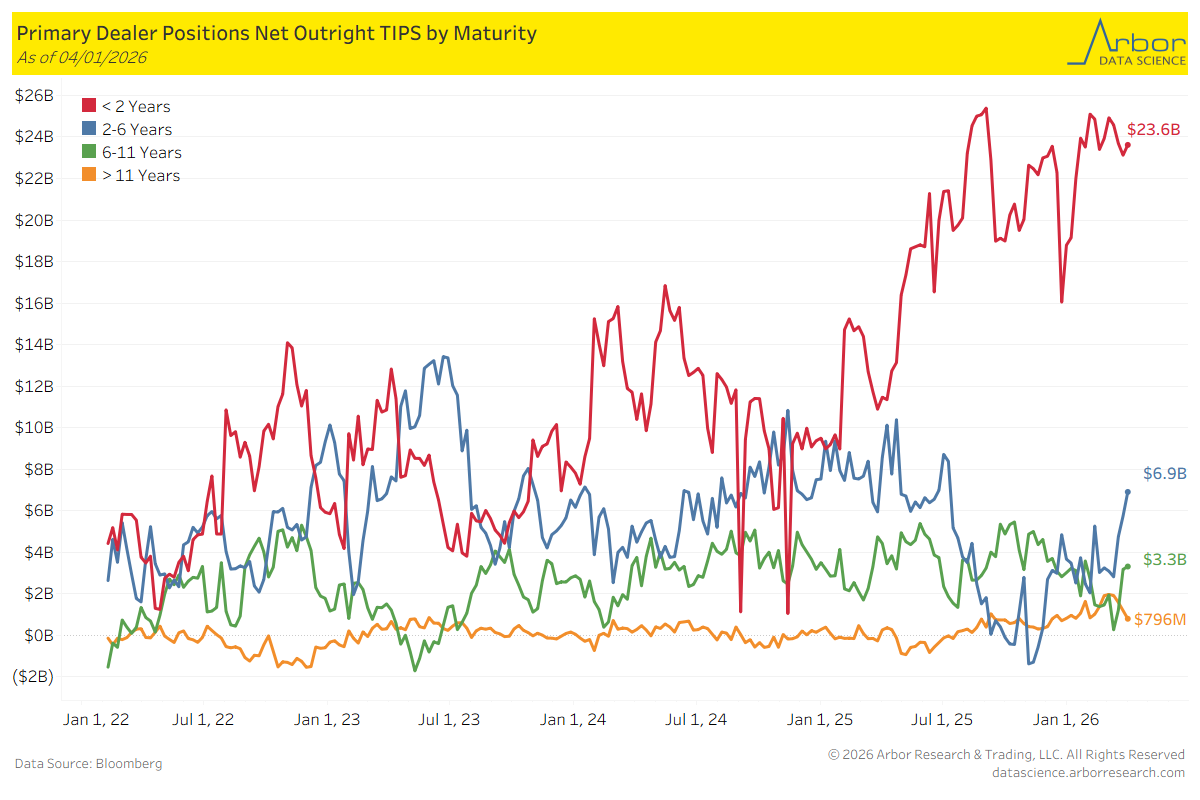
TIPS by Maturity (data through 4/01/2026)
Week over Week Changes by Maturity
- < 2 years: $23.1 Bn on 3/25/2026 to $23.6 Bn on 4/01/2026 = $0.5 Bn
- 2 – 6 years: $5.7 Bn on 3/25/2026 to $6.9 Bn on 4/01/2026 = $1.2 Bn
- 6 – 11 years: $3.2 Bn on 3/25/2026 to $3.3 Bn on 4/01/2026= $0.1 Bn
- > 11 years: $1.9 Bn on 3/25/2026 to $796 Mn on 4/01/2026 = ($394 Mn)
US Treasury Trade Fails
As of 4/09/2026, U.S. Treasury Fails were $27.28 billion and U.S. Agency Fails were $6.90 million.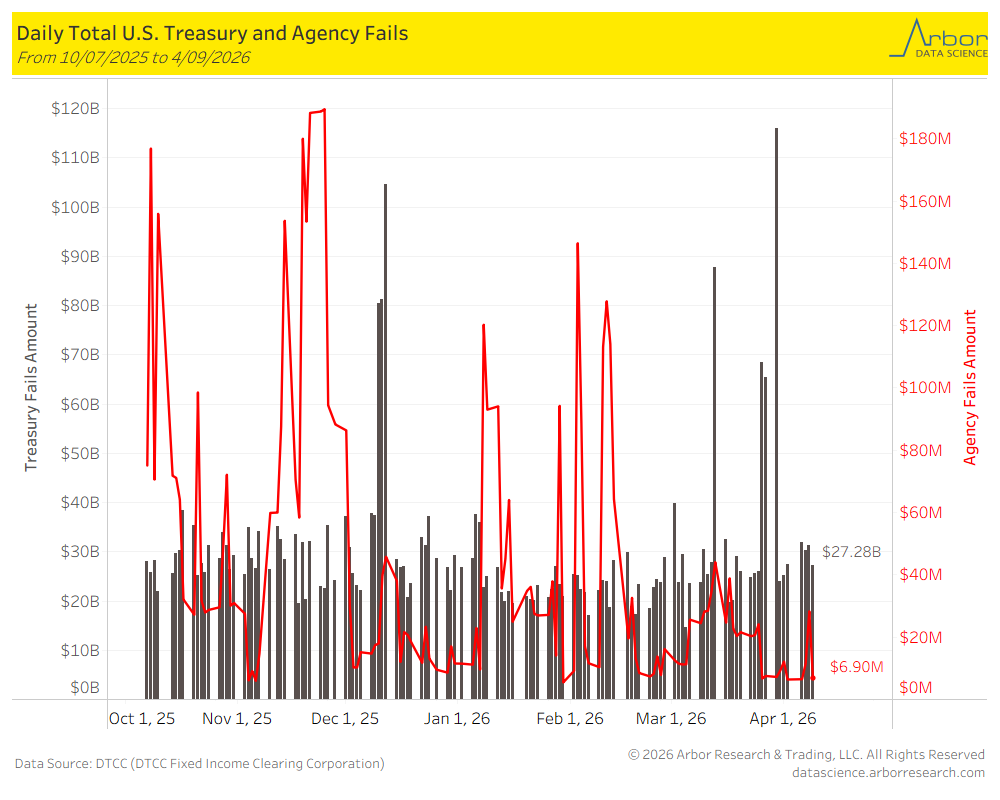
Intraday Commentary From Jim Bianco
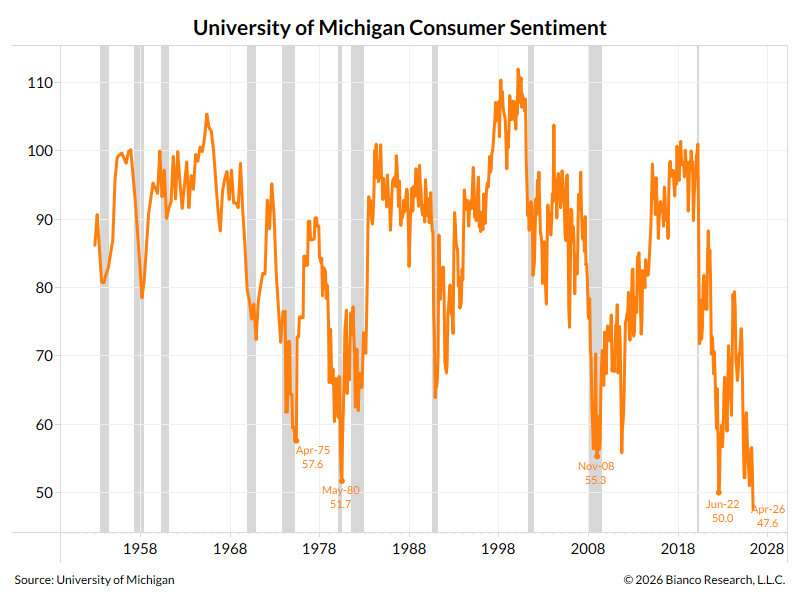
The University of Michigan has been conducting a consumer confidence survey for 74 years (starting in 1952). The lowest reading in this history is the number out today for April 2026 at 47.6. The commentary from the University of Michigan attributes it solely to the war, since 98% of their surveys were conducted before the April 7th ceasefire announcement. I find this explanation wanting.
Since 1952, we’ve had our share of wars and 9/11. Yet the conflict has produced a 74-year low among consumers, but only a 3% correction in the stock market. Does this make sense? Regarding the current conflict, is it worse than the Korean War, the historic protests over the Vietnam War in the 1970s, or the never-ending quagmire in Iraq? This was the conflict that drove us to a 74-year low?
Maybe it is the affordability crisis, which is really the cumulative increase of inflation over the last five or six years, which is being missed by economists who look at the year-over-year rate and try to say it is “well anchored.” This would be my guess.
Best explanation:
The record low probably isn’t about any single hardship being worse than history. It’s about a combination of a population already fatigued from 2021-2023 inflation, now facing a war-driven energy shock with an unclear endpoint, at a moment when inflation expectations had not fully re-anchored. The fear multiplier is higher because the baseline trust in price stability is lower than it was in, say, 2008. That’s the variable that’s different from every prior episode.
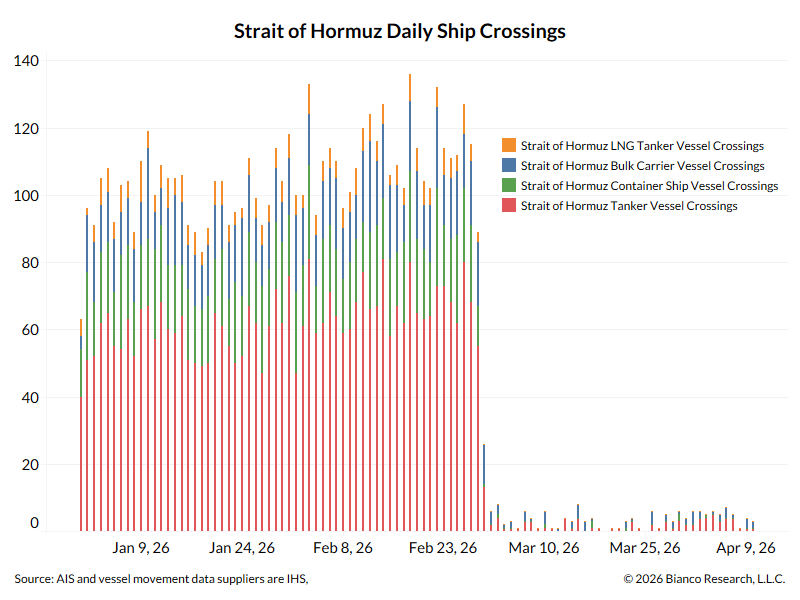
The ceasefire is holding for a second day. Now comes the talks in Pakistan this weekend.
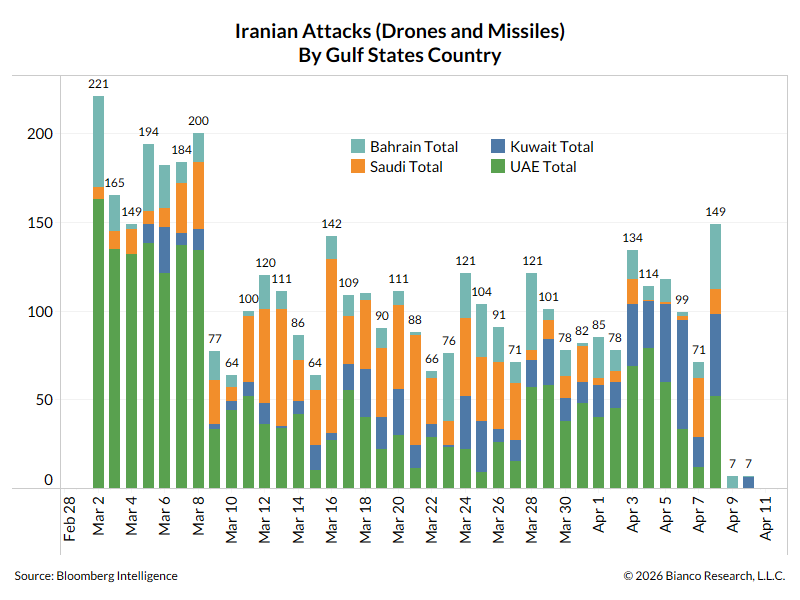
But no signs of shipping moving … yet???
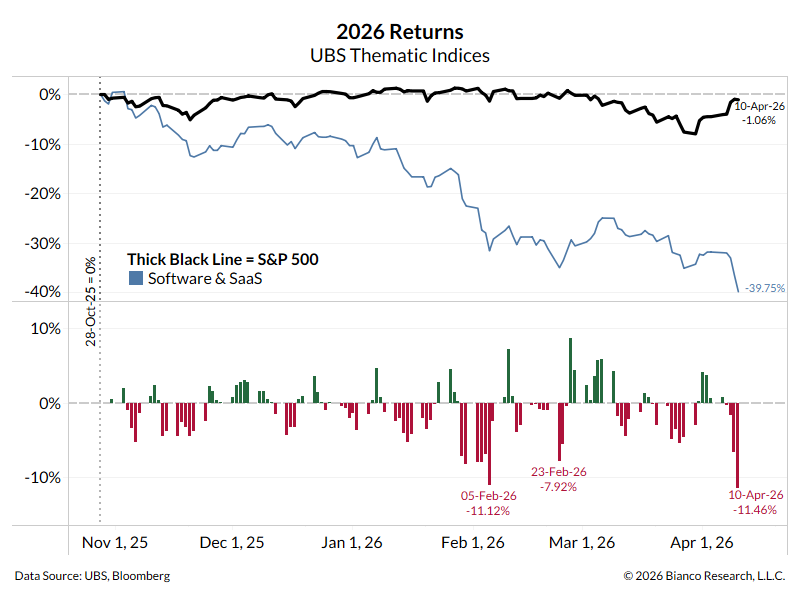
Update … this chart now starts on October 28, 2025, the all-time high of the SaaS index (blue). SaaS stocks are now down 40% (blue) while the S&P 500 is down 1% (black). The last three days, the reaction to the power/fear of Mythos, is down 11.46% (5.15% today alone) for the worst decline of the entire SaaSpocalypse or Armageddon.
In the News
ZeroHedge: Mexico’s “Energy Sovereignty” Dos Bocas Oil Refinery Hit By Major Fire
SupplyChainBrain: USPS Asks to Raise Stamp Price to 82 Cents to Ease Cash Crisis
mint: Wildfires Race Across US as Drought Spans Half the Nation
Bloomberg: Pawn Shop Loans Spike as Gas Prices Weigh on Americans
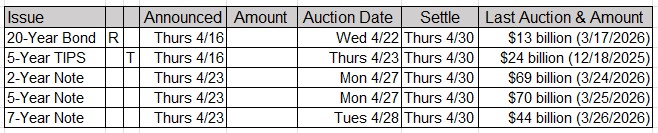
Upcoming US Treasury Supply
Upcoming Economic Releases & Fed Speak