Tuesday’s range for UST 10y: 4.16% – 4.24%, closing at 4.17%
Bloomberg: Simon White:
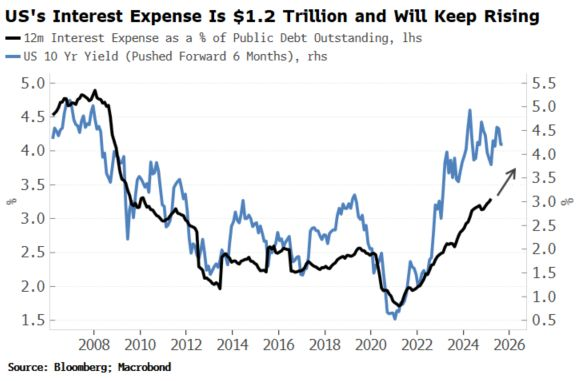
A reminder that just because US yields are off their recent highs, the US’s huge interest bill on its debt has not gone away.
Not only has it not gone away, the fact yields are still on net higher than they were last year means a further rise in the bill is baked in the cake (see chart).
The interest bill is already at $1.2 trillion, 4% of GDP or, remarkably, almost 20% of tax revenues. The CBO expects that to rise to the point that $1 in every $4 of tax revenue is going purely to pay coupons to bond holders. That means it will be difficult to reduce the fiscal deficit, with increasing amounts new debt issued solely to pay interest .
The US cannot afford higher yields. That’s not to say it won’t happen though, prompting, perhaps, more QE or yield curve control at some point, and/or financial repression, coercing domestic capital into the Treasury market.
When three Seattle office buildings a short distance from Amazon.com Inc.’s headquarters defaulted on $135 million worth of commercial mortgage debt last month, it left bond investors who financed the properties facing a long and uncertain slog to claw back money.
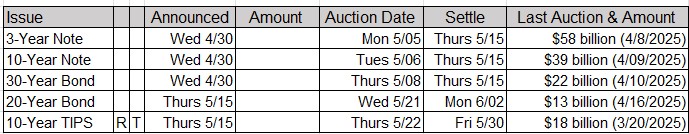
Upcoming US Treasury Supply
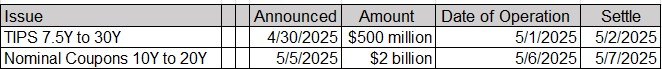
Tentative Schedule of Treasury Buyback Operations
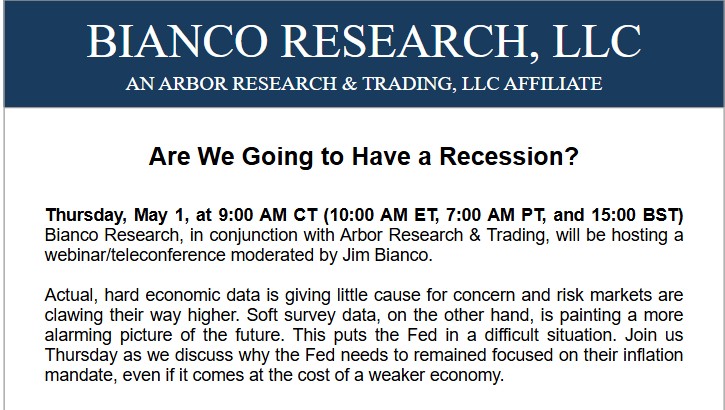
Join Us for Our Next Conference Call: Thursday, May 1, 2025, Featuring Jim Bianco
Jim Bianco Joins Fox Business to Discuss Globalization, Earnings, Fed Cuts/Hikes, Recession Odds
Intraday Commentary From Jim Bianco
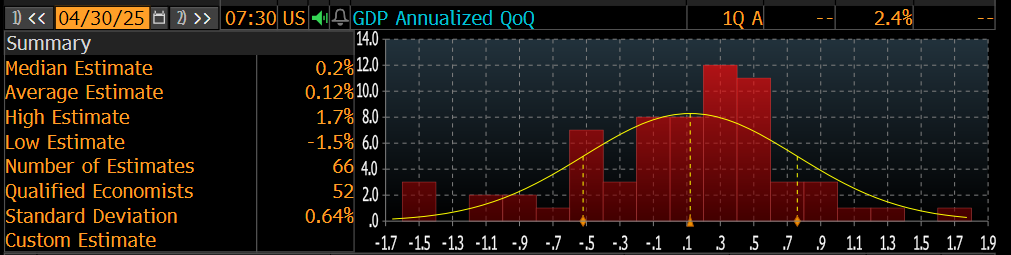
Updated (based on today’s trade data) …The 66 economists surveyed by Bloomberg estimate GDP grew by an annualized 0.2% in the first quarter, down from Q4’s annualized growth rate of 2.4%. Estimates range as low as -1.5% and as high as 1.7%. Of note, 26 economists (or over 39% of all respondents) forecast 0.0% or lower growth rates.
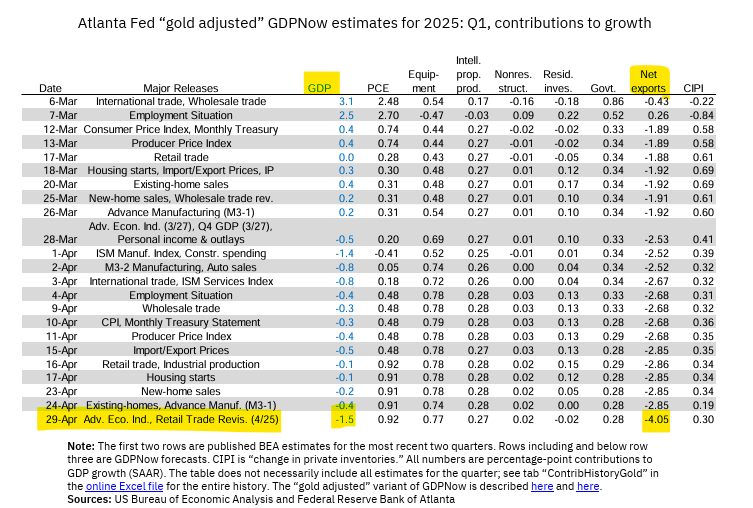
As noted above, the latest GDPNow update from the Atlanta Fed nowcasts -2.7% annualized GDP growth in the first quarter. After adjusting for the quirk in gold inventories, this growth rate is -1.5%. These figures were updated with today’s March trade data.
The table below shows the contributions to the Atlanta Fed’s gold-adjusted GDPNow measure. The yellow highlighted section notes net exports took a 4.05% bite out of gold-adjusted GDPNow.
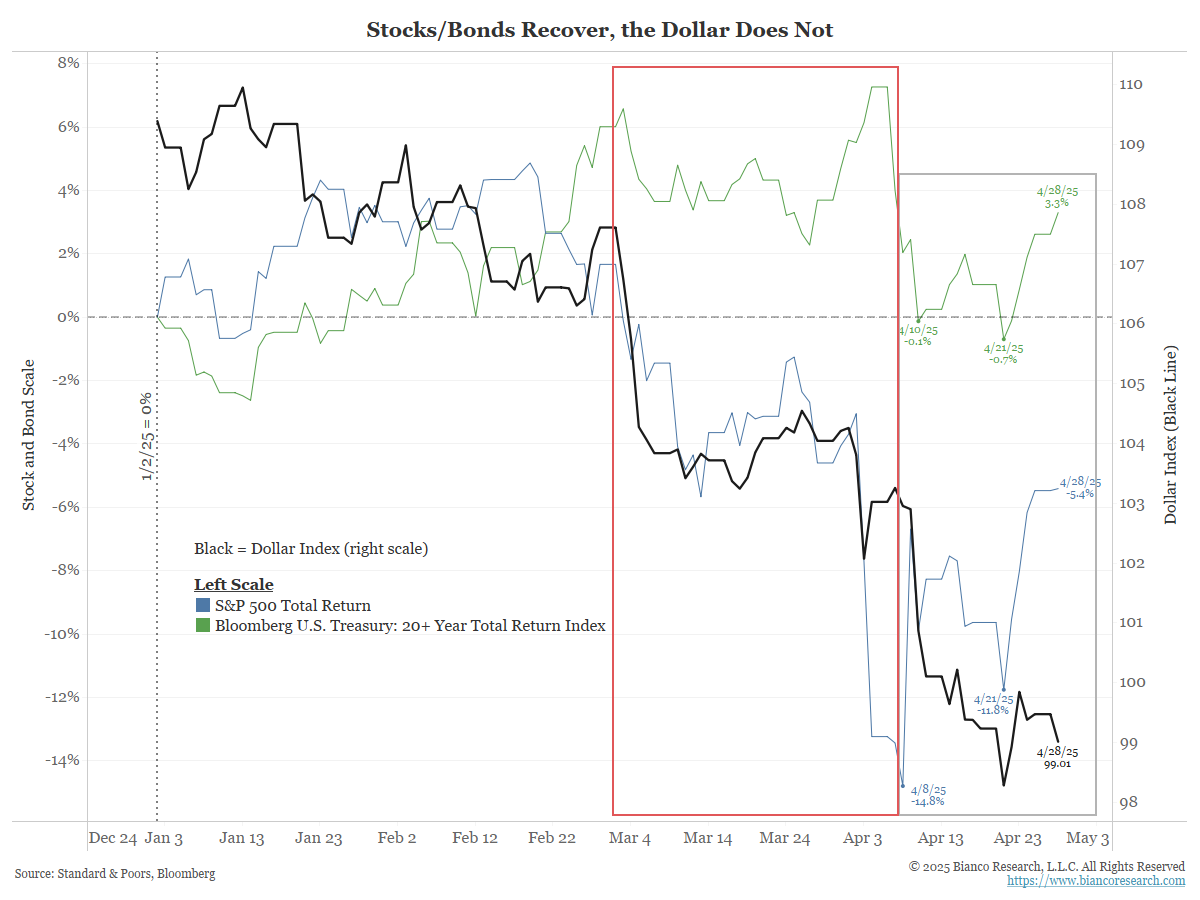
Black = Dollar Index (right scale)
Blue/Green = YTD total returns for stocks (blue) and bonds (green) on the left scale.
Red box = early March to a few days after Liberation Day. This was when stocks, bonds, and the dollar were all declining. This was the “end of American Exceptionalism,” the US is trading like an emerging market, and the end of dollar dominance.
The implication was that the US market could not rally again without the dollar recovering.Gray Box = The last three weeks or so. The Dollar Index (black) kept declining, but stocks (blue) are 10% higher than their April 8 close. Bonds are 4+ higher in a week.Just three weeks ago, such stock and bond recoveries were impossible unless the dollar recovered. —- Be careful with market narratives. They are often wrong. With this one, we need to revisit all the tropes from three weeks ago.
Is this really the end of US exceptionalism?
Other than a few days, are US markets trading like emerging markets?
New US tariffs on aluminum imports have caused a sharp increase in prices, leading to record highs for domestic aluminum and impacting various industries that rely on the metal.
Rates in the US funding market have been climbing as April ends, flashing a sign that liquidity constraints are building in the plumbing that underlies the world’s biggest financial system.