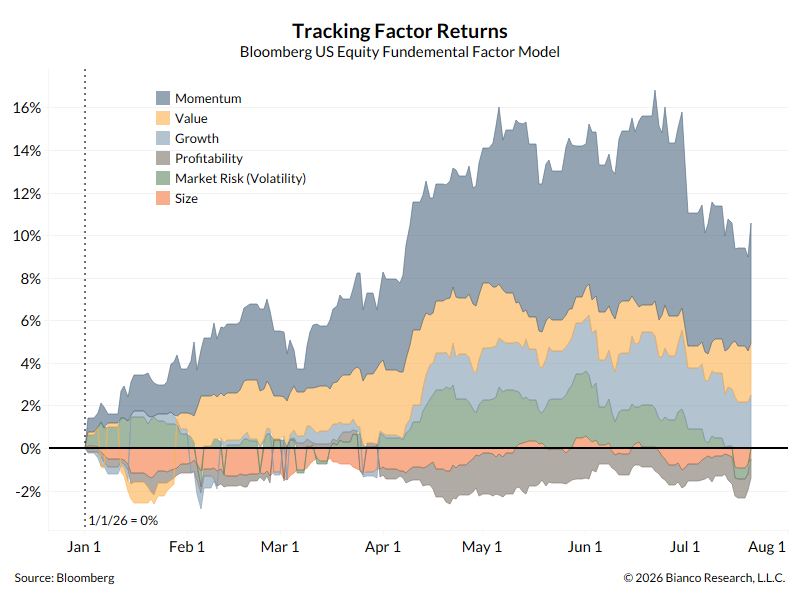
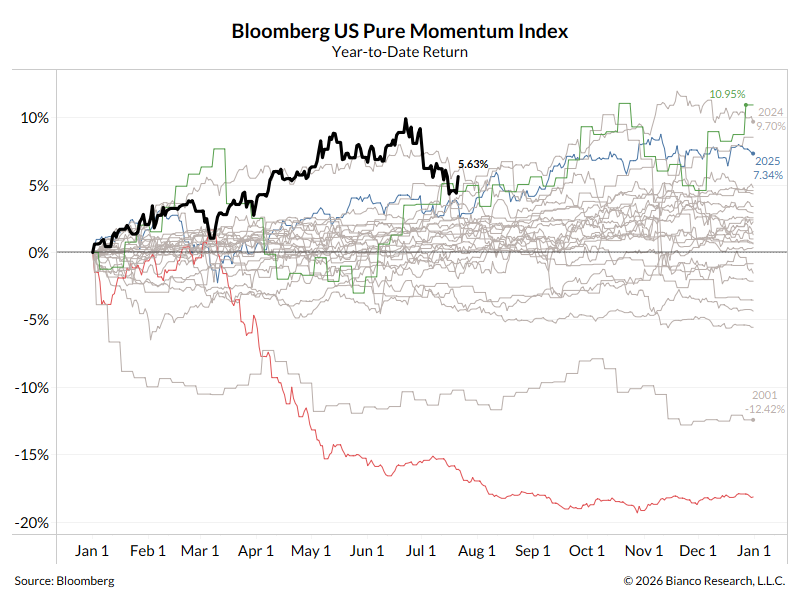
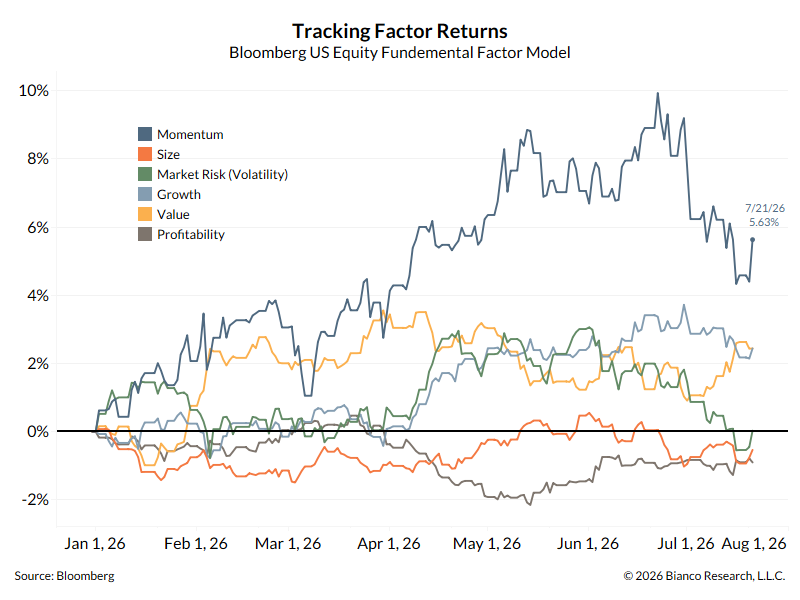
Three different views here. 1st and 3rd are the same view, but one or the other might be clearer to some. The multi-grey line chart shows momentum yearly returns since 2000. This is still the second best year for momentum stocks since 2000 through today.
Momentum (1st and 3rd charts) still dominate factor returns.
On Deck This Week
Alphabet kicks off quarterly earnings from AI hyperscalers tomorrow, Wednesday, 7/22/26
Treasury Auctions this week:
$13 billion UST 20 year Bond Auction (Reopening) tomorrow, Wednesday, 7/22/26
$21 billion UST 10 year TIPS auction on Thursday, 7/23/26
Commodities
Gold increased to $4,083.08 an ounce [75% of its recent high of $5,417 an ounce on 1/28/26]
Silver increased to $58.95 an ounce [50% of its recent high of $116.70 an an ounce on 1/28/26]
Copper increased to 648.95 [97% of its recent high of 667 on 6/2/26]
Upcoming US Treasury Supply
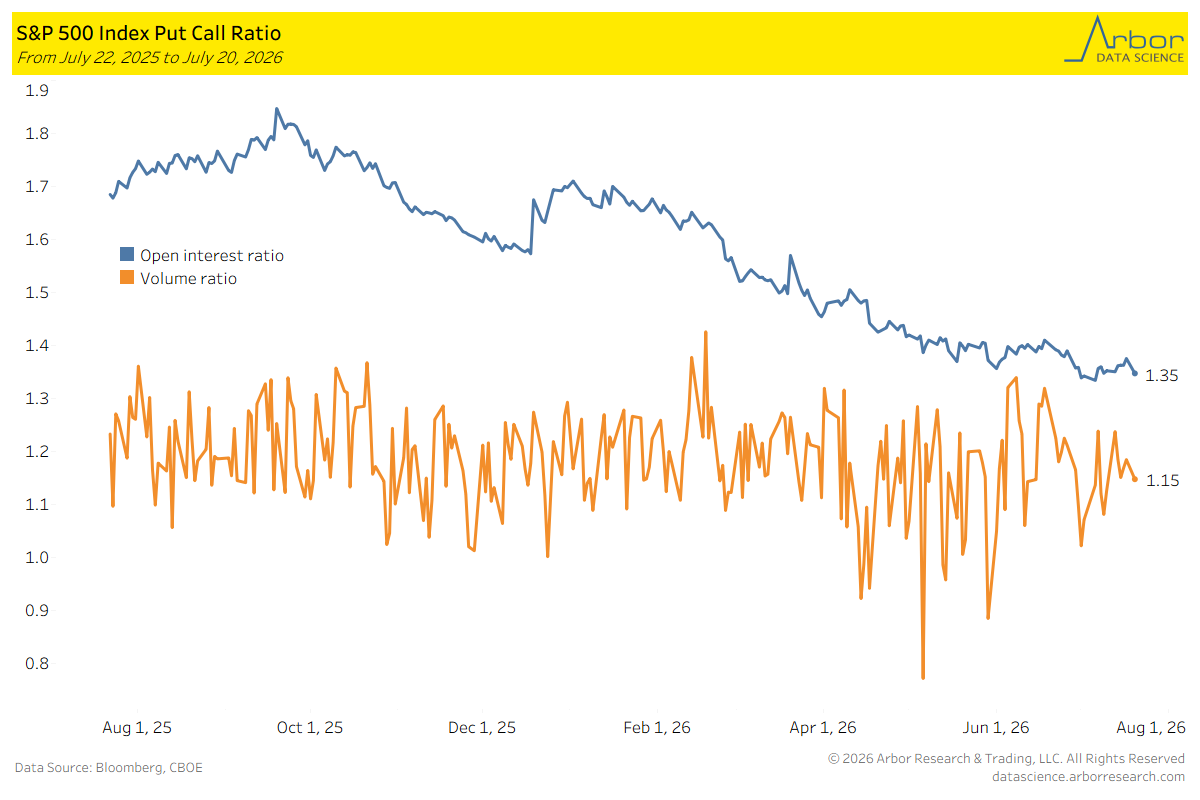
S&P 500 Put / Call Ratio
CBOE SPX Put/Call Ratio (open interest) on 7/16/2026: 1.35
CBOE SPX Put/Call Ratio (volume) on 7/16/2026: 1.15