

US Treasuries
- Treasuries held steady given all of the focus on the equity market today with the $75 Billion SpaceX IPO.
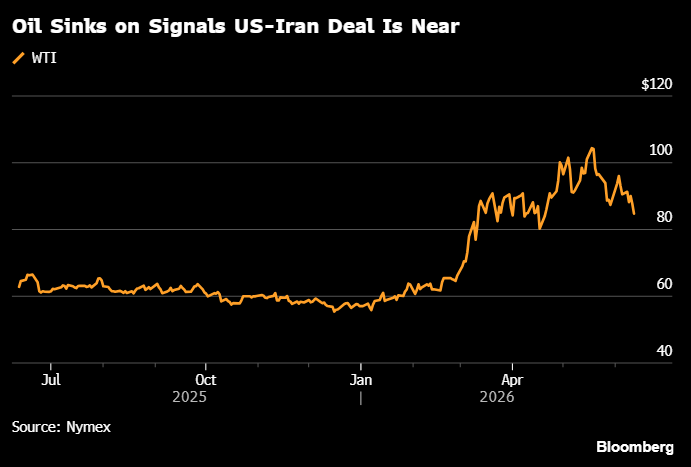
- Oil prices declined and optimism rose as talks continued with Iran.
- 10s closed on Friday at 4.48 [Friday‘s range in 10s: 4.43/4.50]
- 2s closed on Friday at 4.085 [Friday’s range in 2s: 4.03/4.10]
- 2y – 5y: + 13 bps
- 2y – 10y: + 40 bps
- On Deck Next Week: Tuesday (6/16/26): $13 billion UST 20y Bond (Reopening) Auction and Thursday (6/18/26) $24 billion UST 5y TIPS (Reopening) Auction
- On Deck Next Week: Wednesday (6/17/26): First FOMC Interest-Rate Decision under Chairman Kevin Warsh
Commodities
- Gold increased to $4,220 an ounce [78% of its recent high of $5,417 an ounce on 1/28/26]
- Silver increased to $68.09 an ounce [58% of its recent high of $116.70 an an ounce on 1/28/26]
- Copper increased to $6.37 per pound [97% of its recent high of $6.67 per pound on 6/2/26]
Intraday Commentary From Jim Bianco
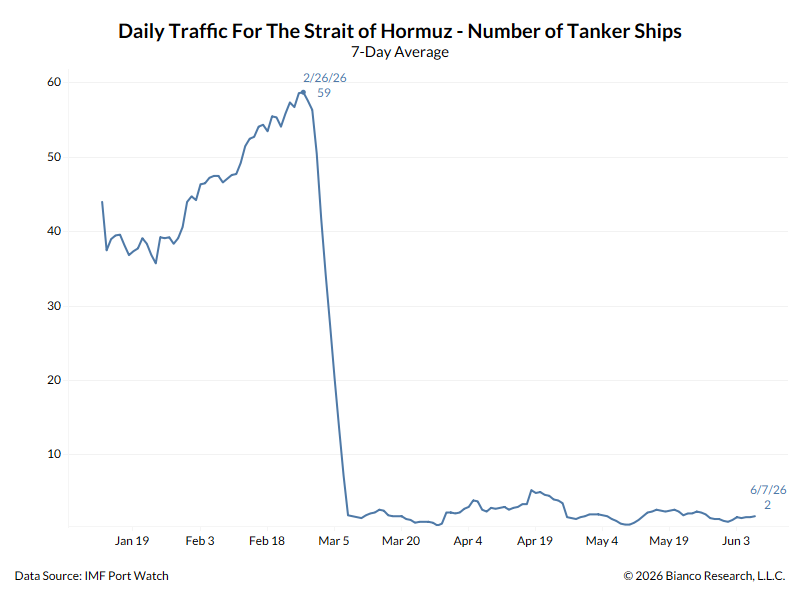
*US ENERGY SECRETARY: FLOWS OUT OF PERSIAN GULF ABOUT 7M B/D
This is what industry experts have believed for three months.
20M B/D before the war
7M B/D now.
So, down 13M B/D
Note, he said, “flows out of the Persian Gulf.” Not “through the Strait of Hormuz.”
Of the 7M B/D, about 5M B/D is going through pipelines that bypass the Strait. 4M B/D is transported via the Saudi East/West (Petroline) pipelines to Yanbu on the Red Sea (western Saudi Arabia). and 1M B/D around the Strait via pipeline in Oman. So, this implies 2M B/D through the Strait. Or, about 1 to 2 supertankers a day. This is exactly what the commercial data shows.
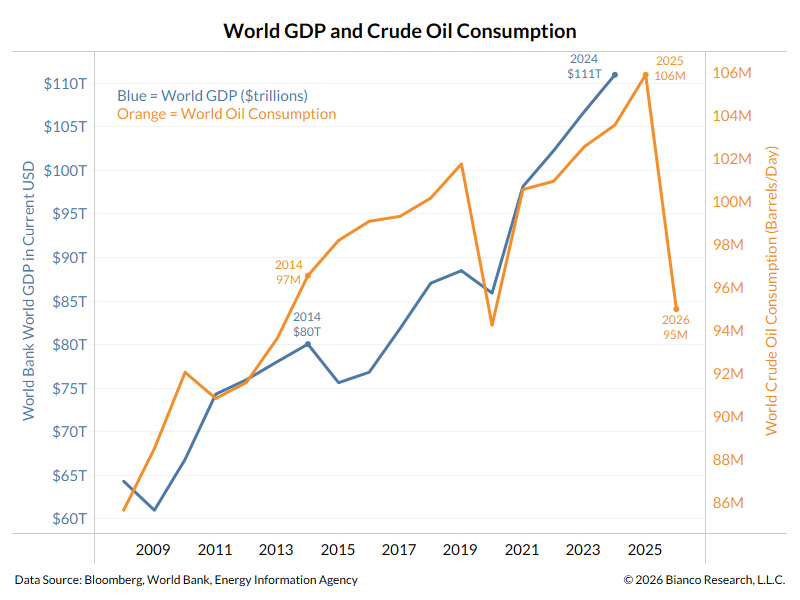
How significant is a 13M B/D deficit? The orange line shows world crude oil consumption. The blue line shows world GDP.
In 2025, the world consumed 106M B/D. Now it is producing about 95M B/D.
Note the GDP line. In 2014, the world consumed 97M B/D, similar to now. World GDP in 2014 was $80T In 2024 (latest data), it was $111T. If the world has to adjust to 95M B/D, this will severely retard world growth. For now, it is being made up by drawing down inventories (essentially China).
Crossing now: Bloomberg hyping it with a red headline
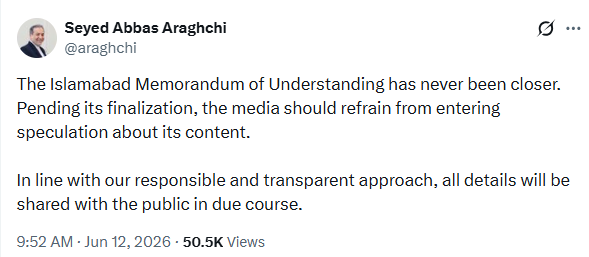
*IRAN’S ARAGHCHI SAYS US-IRAN MOU ‘HAS NEVER BEEN CLOSER’
Upcoming US Treasury Supply

Treasury Trade Fails
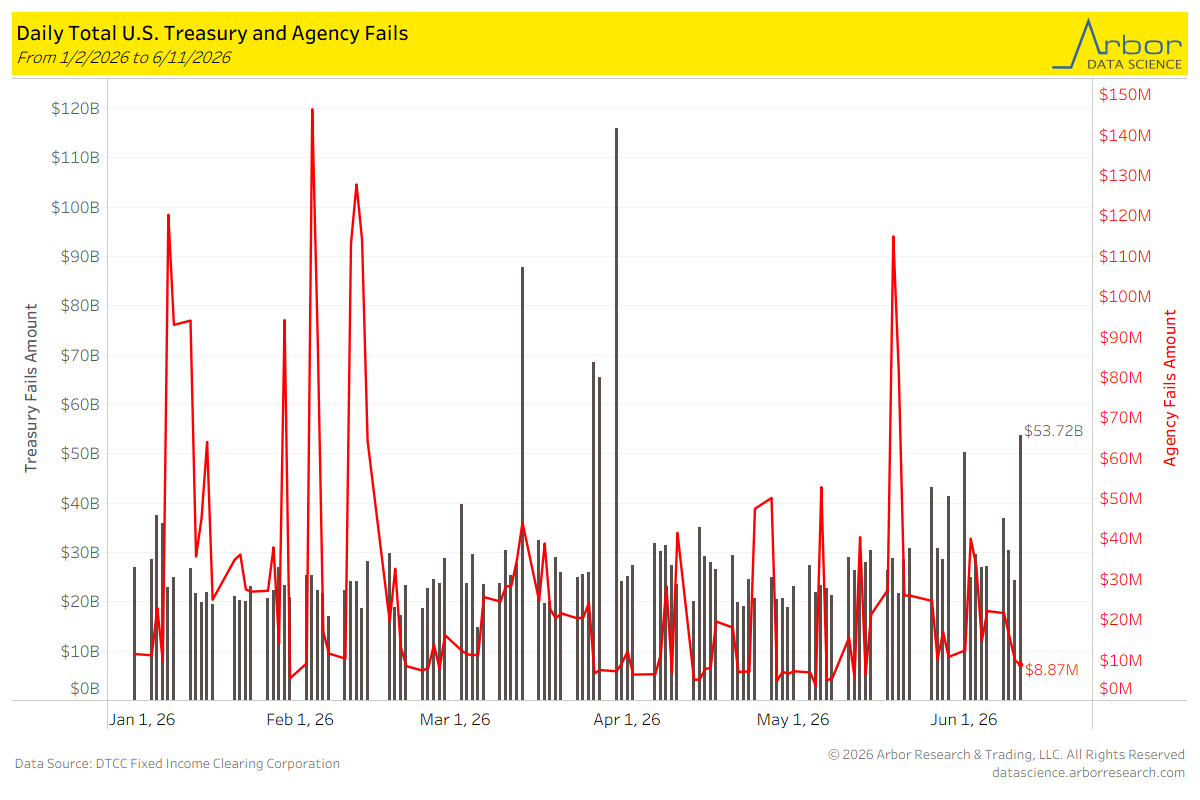
As of 6/11/2026, U.S. Treasury Fails were $53.72 billion and U.S. Agency Fails were $8.87 million.
TIPS By Maturity
Week over Week Changes by Maturity
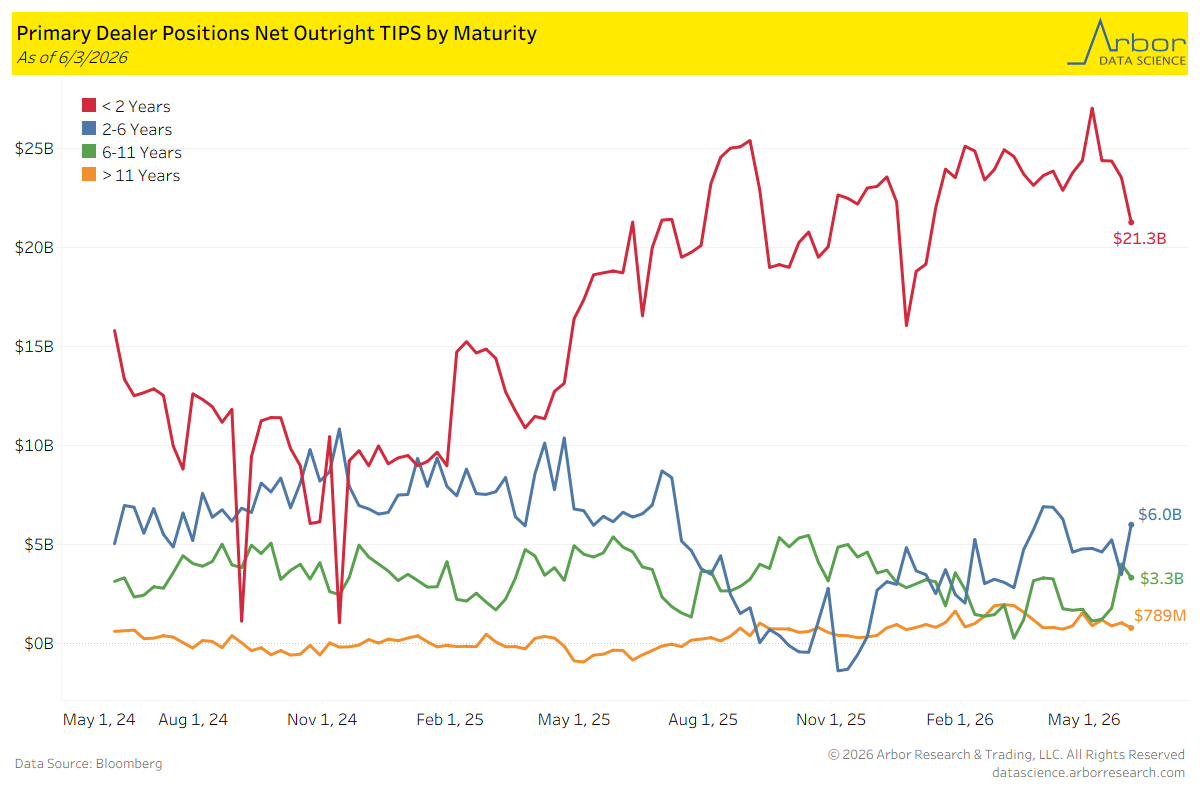
- < 2 years: $23.5 Bn on 5/27/2026 to $21.3 Bn on 6/3/2026 = ($2.2) Bn
- 2 – 6 years: $3.5 Bn on 5/27/2026 to $6.0 Bn on 6/3/2026 = $2.5 Bn
- 6 – 11 years: $4.0 Bn on 5/27/2026 to $3.3 Bn on 6/3/2026 = ($0.7) Bn
- > 11 years: $1,051 Mn on 5/27/2026 to $789 Mn on 6/3/2026 = ($262) Mn
In the News
Upcoming Economic Releases & Fed Speak