

US Treasuries
- Treasury yields climbed as tensions in the Middle East continued and oil prices were slightly higher
- 10s closed on Monday at 4.55 [Monday’s range in 10s: 4.51/4.58]
- 2s closed on Monday at 4.155 [Monday’s range in 2s: 4.12/4.195]
- 2y – 5y: + 12 bps
- 2y – 10y: + 39 bps
Intraday Commentary From Jim Bianco
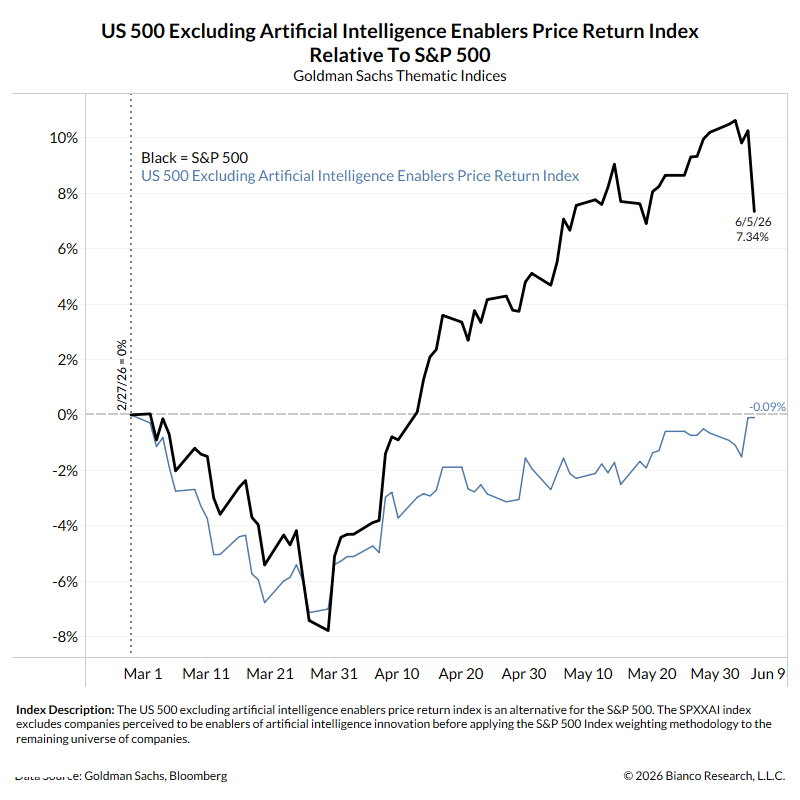
In blue is the Goldman Sachs “US 500 excluding artificial intelligence enablers.” This is effectively an index of the S&P 500 without AI companies.
Since the War began, the S&P 500 is up 7.34% (through Friday’s close). But the S&P 500 without AI stocks is effectively unchanged. So, the entire S&P 500 Index rally since February has been driven by AI stocks.
Given this, what happened on Friday, June 5th, is surprising, but it should not be. On Friday, the S&P 500 was down 2.6%, its biggest daily loss since last October. HOWEVER, the S&P 500 without AI was up 0.02% (call it unchanged). So, the entire sell-off on Friday was AI stocks. The “normal world” did nothing on Friday.
It is AI’s world, we only live in it.
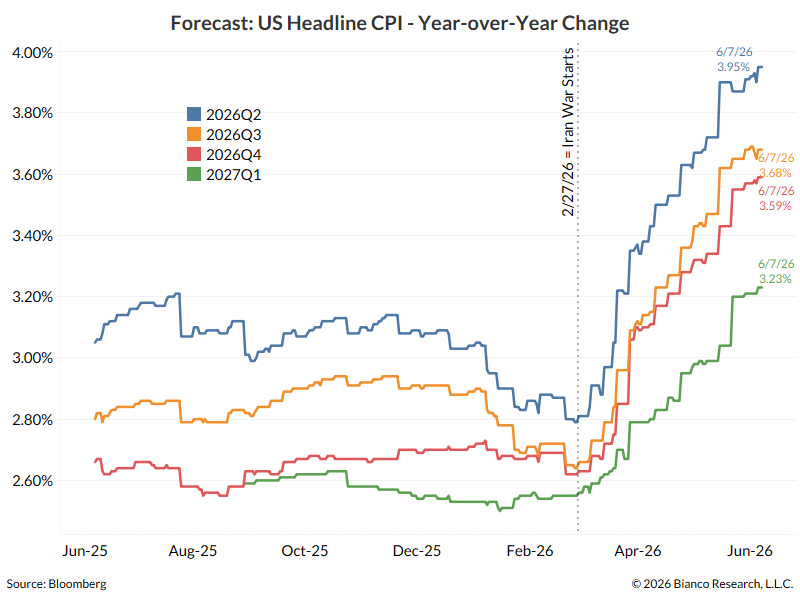
CPI Preview: May CPI is estimated to have risen 0.5% to 4.2% (yoy). May Core CPI is estimated to have risen 03% to2.9% (yoy).
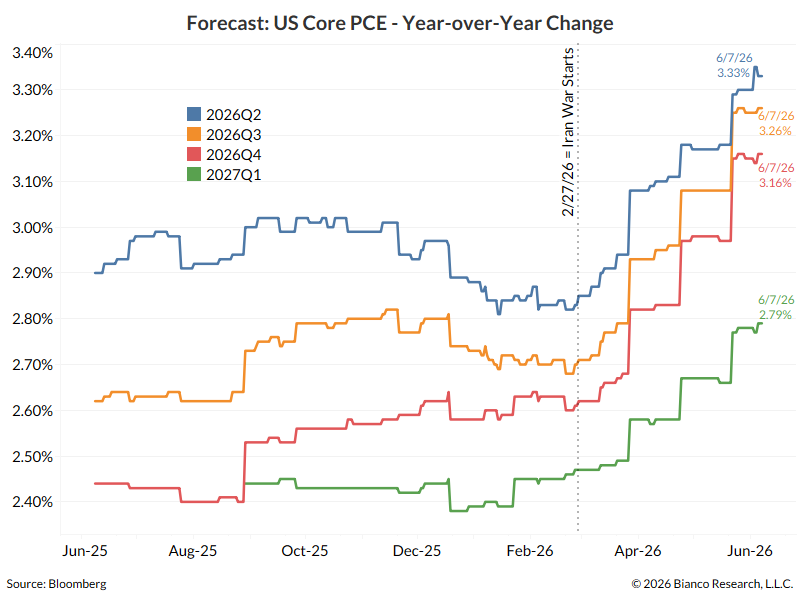
Is it all gasoline/War? Here is the same measure for Core PCE, excluding energy, which is (currently) the Fed’s favorite measure of inflation.It is expected to stay above 3% for the balance of the year, and only fall to 2.79% by Q1 2027.
Wall Street always makes mistakes on their forecasts. The question is which way? The black line is CPI. All the colored lines are the monthly forecasts 18 months into the future. Note that before the 2020 recession (gray bar), all the forecasts were above the black line. Meaning that inflation kept coming in below estimates. But note that this completely inverted after 2020, now all the forecasts are below the black line, meaning that inflation is lower than estimates.
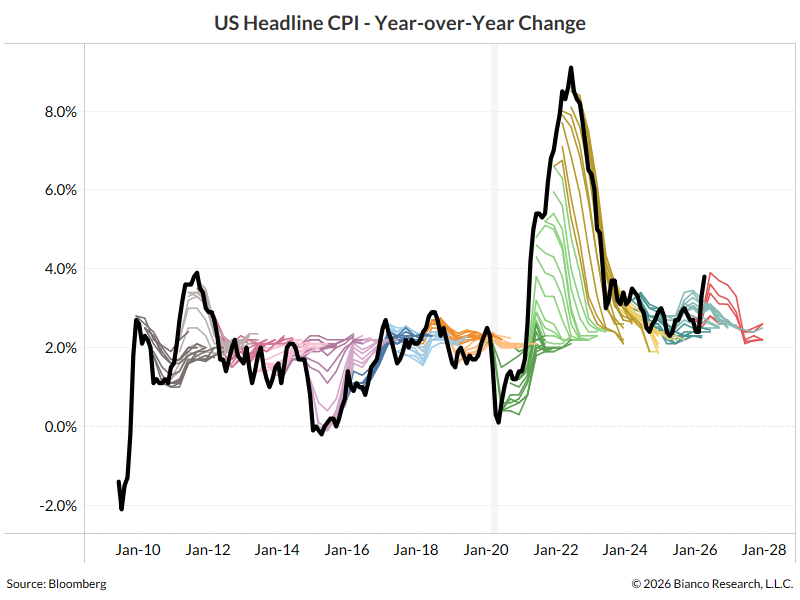
This is what I’ve been arguing since 2021: the cycle is turned, Wall Street still thinks it’s 2019, and they’re always too low on their inflation forecasts.
Now they think inflation will remain above 3% until 2027. Expect them to be too low … again.
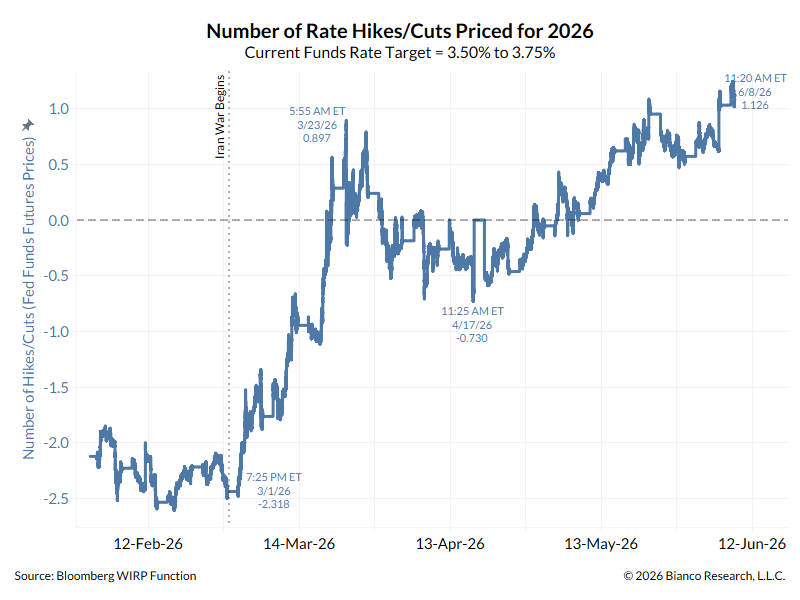
This is why the market is assigning a 112% probability of a 2026 hike (12% probability of a 50 basis point hike). Quite the reversal from 2.5 cuts priced in the day the way started. If anything, they are not aggressive enough on the hikes, because they are still underestimating inflation.
Intraday News Moving Markets
- On Deck tomorrow, Tuesday, 6/9/26: $58 Billion UST 3y Note Auction
- Released this week: CPI (Wednesday, 6/10) and PPI (Thursday, 6/11)
Commodities
- Gold increased to $4,344 an ounce [80% of its recent high of $5,417 an ounce on 1/28/26]
- Silver declined to $68.60 an ounce [58% of its recent high of $116.70 an an ounce on 1/28/26]
- Copper increased to $6.34 per pound [95% of its recent high of $6.67 per pound on 6/2/26]
Upcoming US Treasury Supply

In the News
Upcoming Economic Releases & Fed Speak