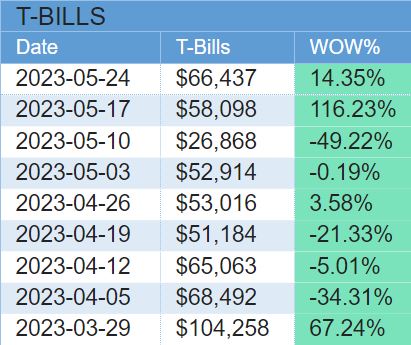
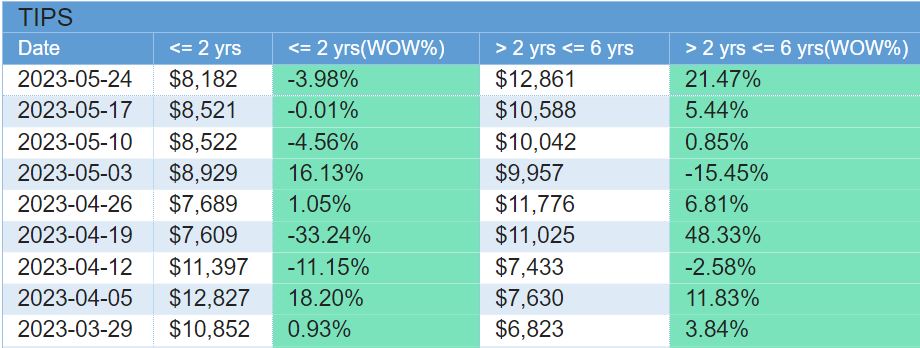
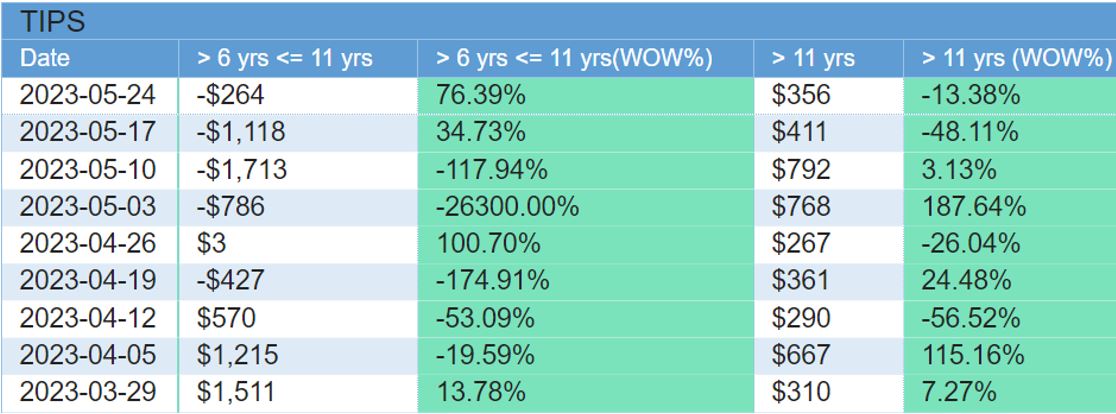
TIPS YTD Recap
YTD TIPS ETF’s (listed in chart below with $’s in millions) have had $7.6bln net outflows, led by Schwab, iShares and Vanguard funds.
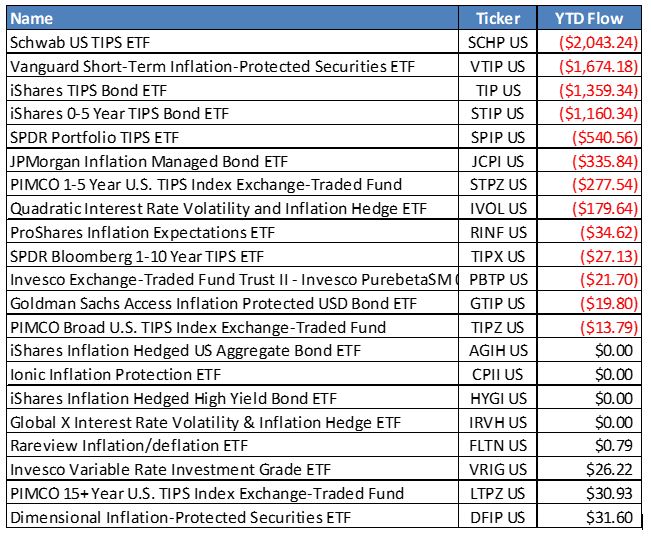
Inflation is cooling as commodities have fallen, which has resulted in weak TIP demand and volumes. But it all comes down to Total Returns. TIPS continue to prove themselves are better alternative to Treasuries over the long term.
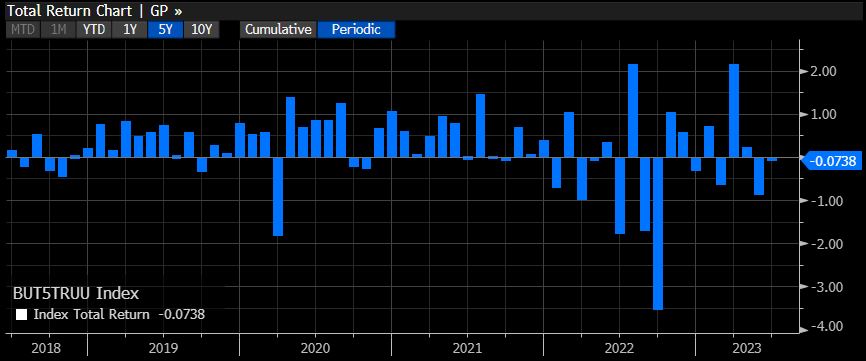
1-5 TIPS Index has returned 14.46% over the past 5yrs and 17.05% over the past 10yrs. ![]()
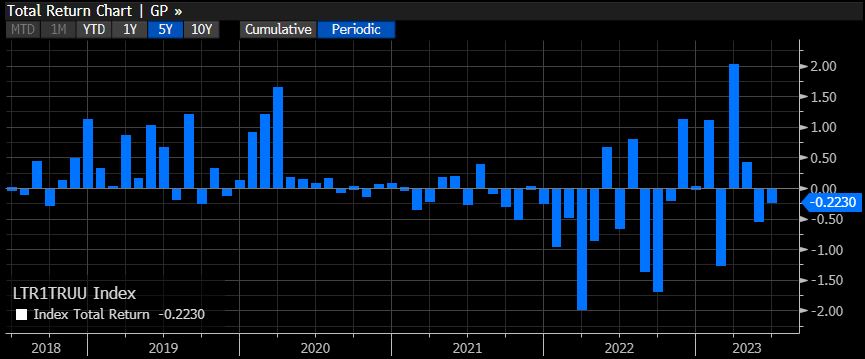
1-5 US Treasury Index has returned 5.19% over the past 5yrs, and 8.73% over the past 10yrs.
![]()
US Treasury TIPS 1-5 Years Index Total Monthly Returns for last 5 year Period:
US Treasury Index (1 – 5 yr Treasuries) Total Monthly Returns for last 5 year Period:
TIPS Today
Light volumes in TIPS yesterday (10.6bln). TIPS are opening weaker with energy, oil -2%. Saudi’s surprise supply cut rally has been quickly erased. Trading is expected to be light in TIPS ahead of CPI and FOMC next week.
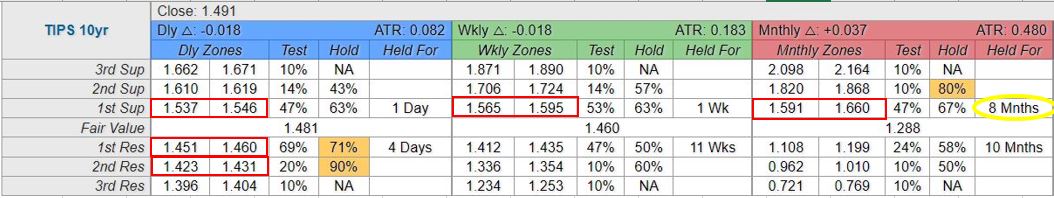
Today’s Range for UST 10y TIPS: 1.45 – 1.52 (click on image to enlarge)
Bloomberg Inflation Index YTD Total Return: 2.07%
Bloomberg US Treasury Index YTD Total Return: 2.01%
Date TIPS vol (bln) % <=5yrs
6/1 16.9 0.57%
6/2 12.1 0.52%
6/5 10.6 0.69%
Arbor Quantitative Analytics
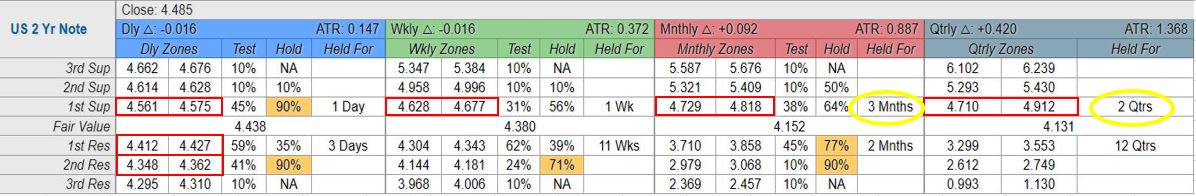
Today’s Range for UST 2y Note: 4.44 – 4.53
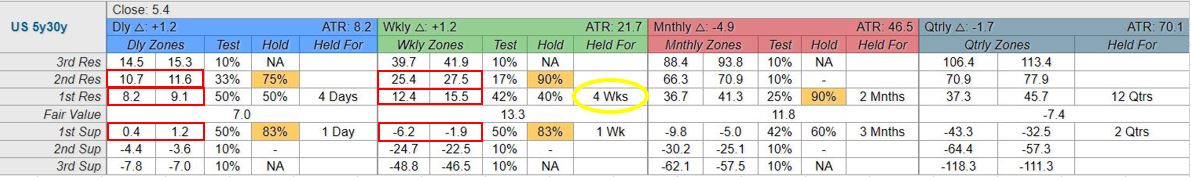
Today’s UST 5y/30y Spread has traded in a Range of: 3.095 bps – 8.135 bps
What’s On Tap For The Week Ahead
Arbor Daily IG Credit Market Recap 6/5/23
B of A IG index: -+0bps y’day -3bps MTD
S&P: -0.2% NASDAQ: +0% WTI: +0% UST 10Y: -0.7bps UST 30Y: +0.1bps
Treasuries traded sideways to open the week as the primary issuance calendar took center stage. 10 new deals priced, totaling $b. Secondary volumes finished the session +11% v. avg with dealers buying $1b more than they sold, skewed towards high-grade. Flows out the curve were below avg, leading a bulk of the activity to be in 3-12y mtys. Cash spreads were mixed w/ those sectors who had issuance underperforming. Financials closed +2-5bps w/ new deals coming from TFC and COF. Longer spreads were soft given the focus on shorter mtys. ‘A’ rated intermediate industrial spreads closed unchanged to 2 tighter with demand outpacing
Chart of the Day from Bianco Research: Which Companies Are Conducting Buybacks?
Buybacks offer companies a way to increase shareholder value without issuing a taxable dividend. Buybacks among the largest companies make sense given the large cash hoards they hold.
The chart looks at buybacks among the ten largest companies by market cap. This group changes each quarter, but the ten largest companies as of Q1 2023 are listed on the chart. Outside of Berkshire, Visa, and Exxon, it is a list of big tech.
As the chart shows, roughly 29% of all S&P 500 buybacks came from the ten biggest companies. Some have gone as far as questioning if these large buybacks are the reason these stocks have outperformed the market. While this may seem like a large percentage, it is worth noting these ten companies also account for 29% of the S&P 500’s market cap. In other words, their buybacks are in line with their relative size.
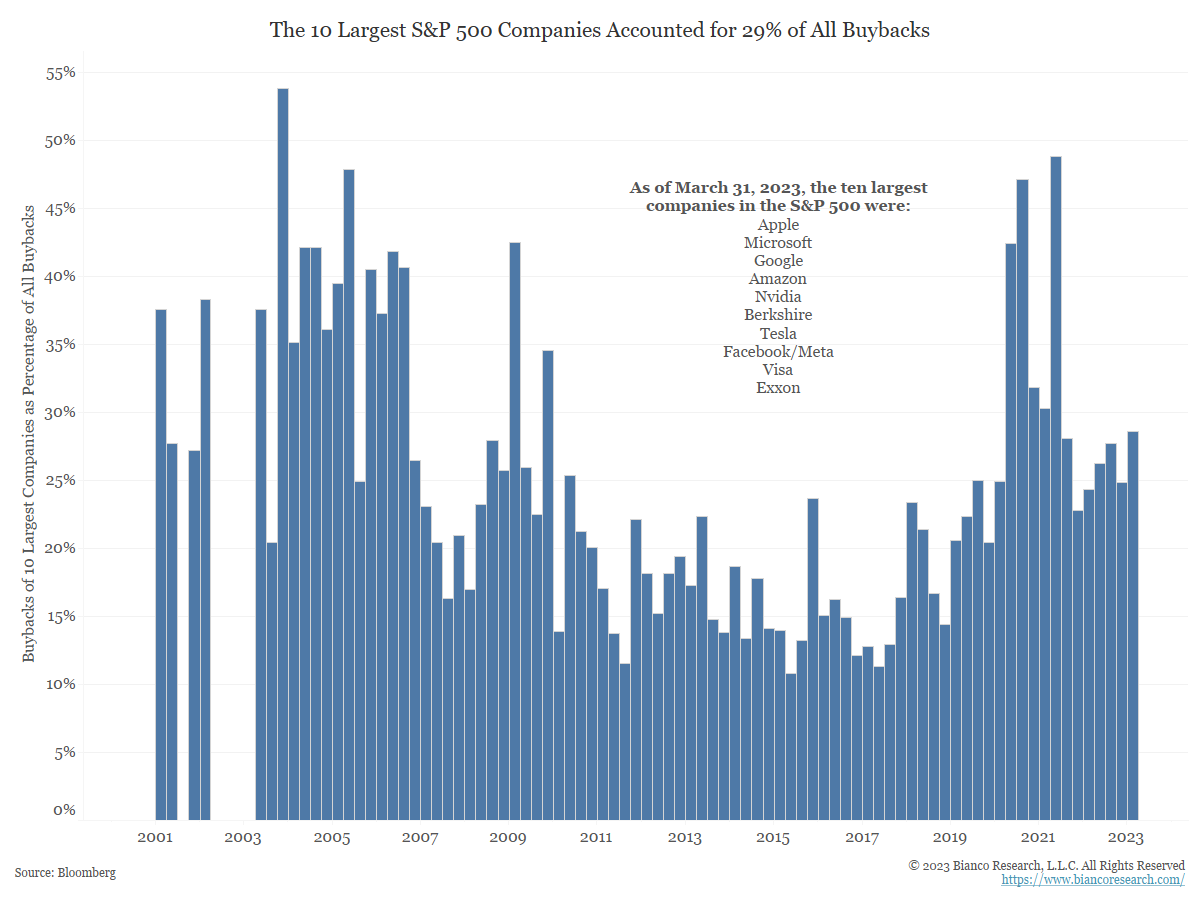
Chart of the Day from Arbor Data Science: US ETF Flow- Energy
The big weekend headline was that Saudi Arabia intends to further cut its oil production into July as part of an OPEC+ effort to boost prices. Crude oil jumped in the aftermath but has since pulled back. Energy investors have been in a pinch recently, with the US Energy Sector SPDR ETF (ticker: XLE) down over 8% in the past three months. That same fund has seen over $2.6 billion outflow year to date. Over $1 billion of those outflows left in the past month. 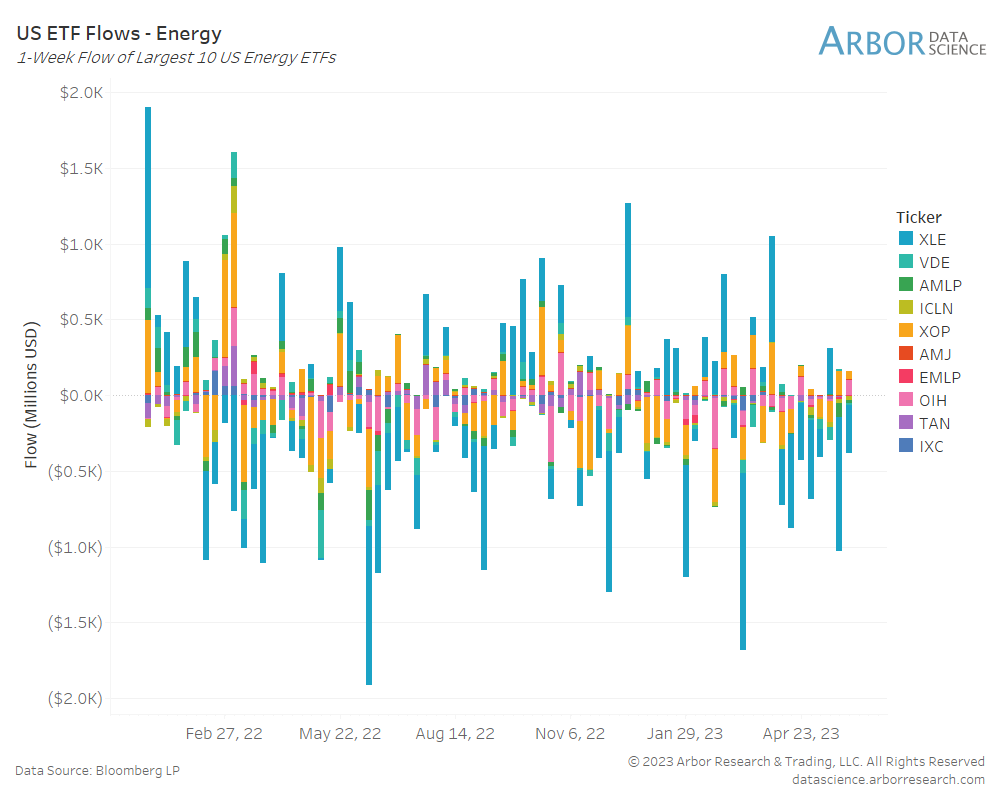
Dealer Positions ($’s in millions of dollars)
Topics Our Clients Are Discussing Today
Citi: Oil Prices Unlikely To Hit The High $80s After Saudi Output Cut
While many analysts see the latest Saudi oil cut surprise as bullish or at least moderately bullish for prices, Citigroup thinks that the 1 million bpd cut from the world’s top crude exporter is not likely to result in an oil price run-up to the high $80s or low $90s per barrel.
Interest-Only Loans Helped Commercial Property Boom. Now They’re Coming Due.
Nearly $1.5 trillion in commercial mortgages are coming due over the next three years, according to data provider Trepp. Many of the commercial landlords on the hook for the loans are vulnerable to default in part because of the way their loans are structured.
Uninsurable America: Climate change hits the insurance industry
Decisions by two major insurers to stop offering new homeowner’s policies in California highlight the growing portion of America that’s becoming close to uninsurable.
Fleet Sales Continue Hot Streak in May
Sales into large fleets, not including sales into dealer and manufacturer fleets, increased 37.2% year over year in May to 228,342 units, according to an early estimate from Cox Automotive.
“May fleet sales had another strong month of gains over last year with rental, government and commercial all rising,” said Cox Automotive Senior economist Charlie Chesbrough. “However, it is rental fleet showing the largest volume increases, suggesting that the supply chain limitations of 2021 and 2022 are now in the rearview mirror.”
New Car Sales In UK Drive Forward For The Tenth Month
Sales of new cars in the UK increased again last month, new figures out today revealed, marking the tenth successive month of sales growth. Electric cars made up 16.9 percent of new car sales for the month, up 58.7 percent on April’s sales figures.