Download this Report to Print
US Treasuries
In Late Afternoon News [2:23pm CT]…
*PAKISTAN FOREIGN MINISTER POSTS ABOUT TALKS IN POST ON X
*PAKISTAN: REQUEST TRUMP TO EXTEND DEADLINE BY TWO WEEKS
*PAKISTAN: REQUESTS IRAN TO OPEN HORMUZ STAIT FOR TWO WEEKS
*PAKISTAN: URGE WARRING PARTIES TO OBSERVE TWO WEEK CEASEFIRE
*PAKISTAN:DIPLOMACY FOR PEACEFUL SETTLEMENT PROGRESSING STEADILY
*TREASURIES RALLY AFTER PAKISTAN URGES US-IRAN CEASEFIRE
10s closed on Tuesday at 4.32
1st daily resistance is 4.305/4.32 50% to hold 2nd daily resistance is 4.27/4.28 67% to hold 1st weekly resistance at 4.24/4.27 50% to hold 2nd weekly resistance at 4.14/4.17 50% to hold
1st monthly resistance at 4.095/4.125 50% to hold
1st daily support is 4.365/4.38 75% to hold 2nd daily support is 4.40/4.41 1st weekly support at 4.435/4.455 63% to hold
1st monthly support 4.465/4.495 50% to hold
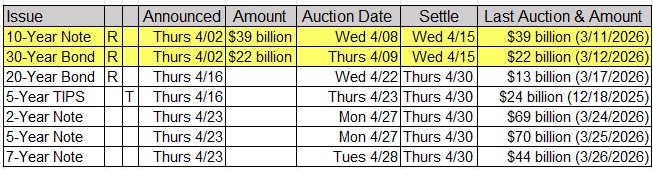
On Deck Tomorrow, Wednesday, 4/08/26: $39 billion UST 10y Note Auction (Reopening) and FOMC Meeting Minutes
Jim Bianco joins the NYSE to discuss how the conflict with Iran is shaping market strategies and economic expectations
Intraday Commentary From Jim Bianco
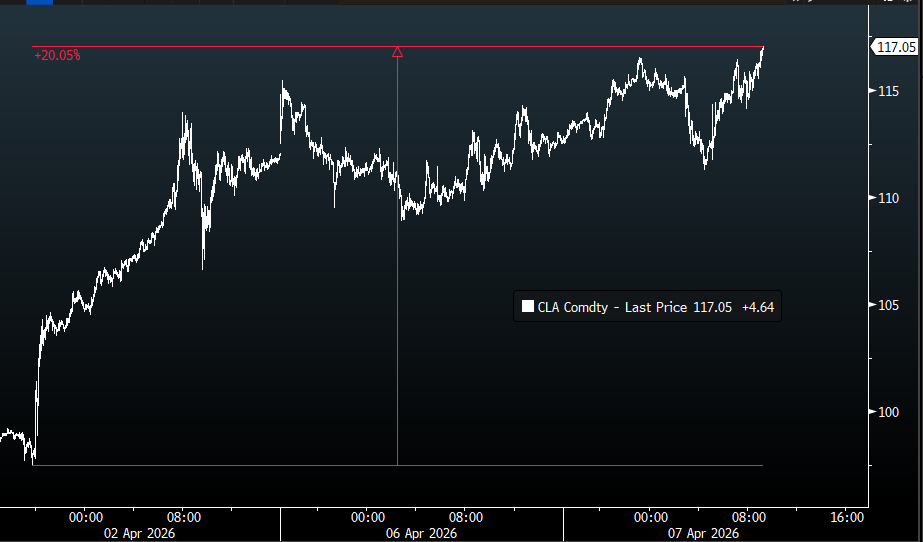
May WTI crude oil futures are now at a new high and up 20% from Friday’s low.
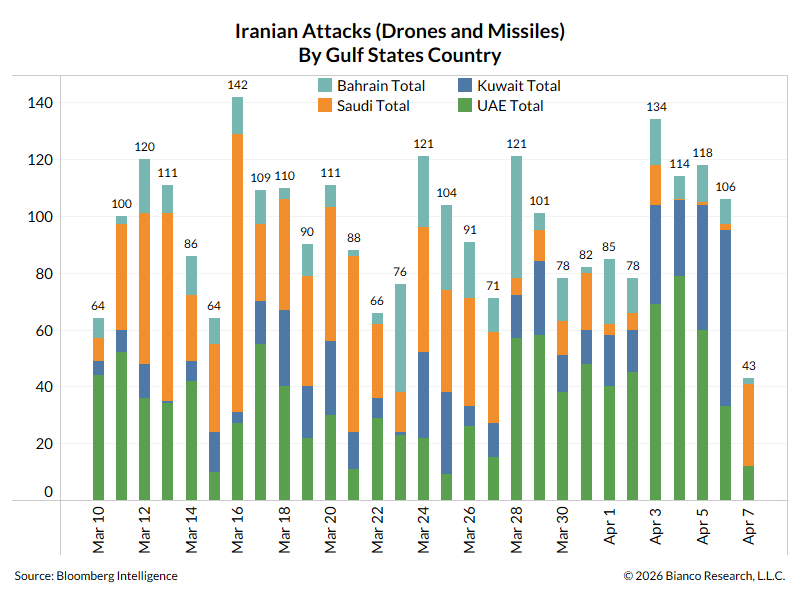
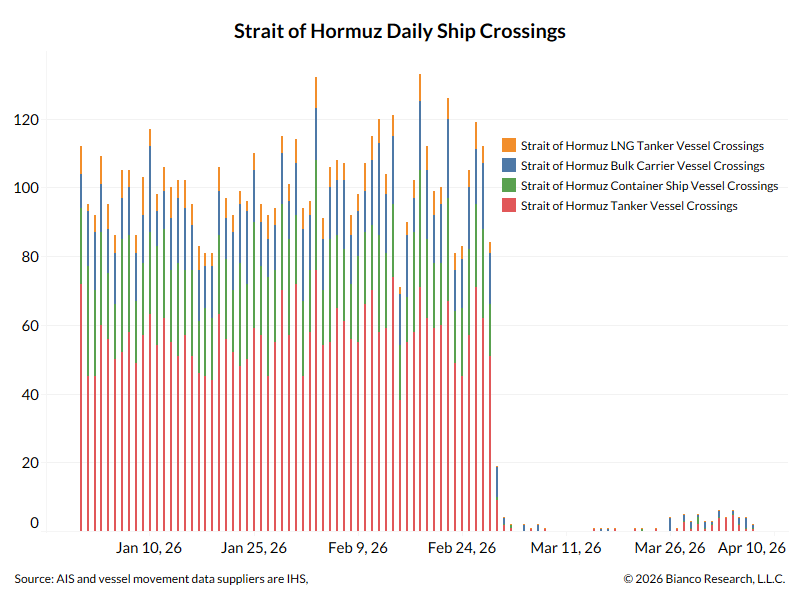
A reminder, this metric has to go to zero (or be believed to be heading to zero) for this situation to normalize. April 7th is through 7AM, so not even the majority of the day.
The S&P was down 60 points (-1%) about an hour ago, now down 22 points (-0.34%). Similarly, crude oil is about $3 lower than its peak an hour ago.
Why? The Iranians reversed (and deleted) their posts saying they had cut off communications with the US, expressing hope that there might be an 11th-hour deal.
If the chart above (drone and missile attacks) can go down, or is believed to be about to go down. Then this chart can go up, and things can return to normal. Upcoming US Treasury Supply
Upcoming Economic Releases & Fed Speak
4/08/2026 at 07:00am EST: MBA Mortgage Applications 4/08/2026 at 01:05pm EST: Fed’s Daly Gives Keynote Remarks 4/08/2026 at 02:00pm EST: FOMC Meeting Minutes 4/09/2026 at 08:30am EST: Personal Income / Personal Spending / Personal Consumption 4/09/2026 at 08:30am EST: PCE Index MoM and YoY / Core PCE Price Index MoM and YoY and QoQ 4/09/2026 at 08:30am EST: Initial Jobless Claims / Initial Claims 4-Wk Moving Avg / Continuing Claims 4/09/2026 at 08:30am EST: GDP Annualized QoQ / GDP Price Index 4/09/2026 at 10:00am EST: Wholesale Inventories MoM / Wholesale Trade Sales MoM 4/10/2026 at 08:30am EST: Real Avg Weekly Earnings YoY / Real Avg Hourly Earnings YoY 4/10/2026 at 08:30am EST: CPI MoM / Core CPI MoM / CPI YoY 4/10/2026 at 08:30am EST: CPI Index NSA / Core CPI Index SA 4/10/2026 at 10:00am EST: Factory Orders / U. of Mich. Sentiment / Factory Orders Ex Trans 4/10/2026 at 10:00am EST: U. of Mich. Current Conditions / U. of Mich. Expectations 4/10/2026 at 10:00am EST: U. of Mich. 1-Yr Inflation / U. of Mich. 5-10 Yr Inflation 4/10/2026 at 10:00am EST: Durable Goods Orders / Durables Ex Transporation 4/10/2026 at 10:00am EST: Cap Good Orders Nondef Ex Air / Cap Goods Ship Nondef Ex Air 4/10/2026 at 10:00am EST: Federal Budget Balance 4/13/2026 at 10:00am EST: Existing Home Sales / Existing Home Sales MoM 4/14/2026 at 06:00am EST: NFIB Small Business Optimism 4/14/2026 at 08:15am EST: ADP Weekly Employment change 4/14/2026 at 08:30am EST: PPI Final Demand MoM / YoY, PPI Ex Food and Energy MoM / YoY 4/14/2026 at 08:30am EST: PPI Ex Food, Energy, Trade MoM / YoY 4/14/2026 at 12:15pm EST: Fed’s Goolsbee Speaks at Semafor World Economy 2026